

Excel for Data Analysis: A Beginner's Guide for Microsoft 365
Learn Excel for data analysis: the five-step workflow, tidy layouts, Excel Tables, cell references and version differences, plus a map of the 13-part series.
Imagine you work at a small FMCG distributor in Indore. Every evening the billing clerk exports the day's invoices: which kirana store bought what, how many cartons, at what rate. By Saturday the owner wants three answers: which area sold the most, which retailers have stopped ordering, and whether sunflower oil is moving faster than last month.
Nobody there is a programmer. They have a laptop, a CSV export and Excel, and with the right habits that is enough.
The export is your raw data. Turning it into a clean list is data cleaning. Adding an Amount column is calculation. "Sales by area" is a summary, and the bar chart you send on WhatsApp is the presentation. That full chain is data analysis, done in a spreadsheet.
Excel for data analysis is the practice of using Microsoft Excel's tables, formulas, pivot tables and charts to turn raw business records into answers and reports.
Throughout this series you will work with one made-up business, Narmada Traders, a distributor that supplies kirana stores in Vijay Nagar, Palasia, Rajwada, Bhawarkuan and Sudama Nagar. Every article reuses its sales sheet, so the examples grow into one project.
What is Excel used for in data analysis?
Microsoft Excel is a spreadsheet application, part of Microsoft 365, that stores data in a grid of cells and recalculates formulas the moment a value changes. Almost every business already has it, which is why analysts use it daily.
Typical analyst tasks in Excel include:
- Reconciling two lists, such as invoices against payments received.
- Summarising sales by month, area, product or salesperson.
- Flagging records that break a rule, such as overdue payments or negative stock.
- Building small dashboards and MIS reports that managers open every week.
A data analyst usually pulls data with SQL, explores it in Excel or Python, and publishes it in Power BI. Excel is the one you touch every day, so start there.
The Excel data analysis workflow, step by step
Every analysis in this series follows the same five steps. Learn them once and every new task feels familiar.
- Import. Paste or open the CSV, or load it with Power Query, then press Ctrl+T to turn the range into an Excel Table.
- Clean. Remove duplicates, trim spaces, fix numbers stored as text and standardise names.
- Calculate. Add columns such as Amount, Month or Discount with formulas.
- Summarise. Build a pivot table or a SUMIFS grid to answer the question.
- Present and automate. Chart the summary, then record a macro if you repeat the job every week.
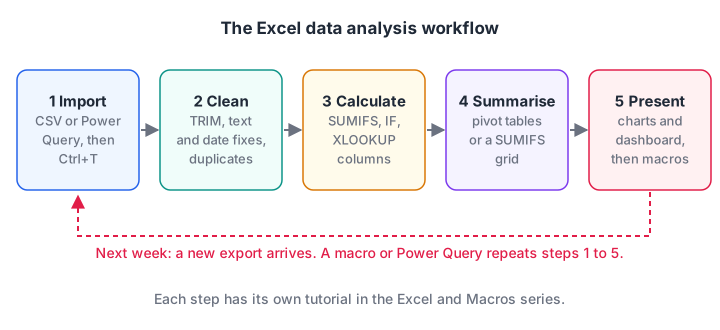
Each step of the workflow has its own tutorial in this series. The arrow back from automate to import is the weekly repeat that macros remove.
How should you lay out data in Excel?
Most Excel trouble comes from layout, not formulas. Merged headings, blank spacer rows and subtotals in the middle look neat but confuse formulas and pivots.
Use a tidy layout instead: one header row, one record per row, one kind of value per column, and no blank rows or merged cells. Here is the Narmada Traders sales sheet in that shape, saved as a Table named Sales. Rate and Amount are in rupees (₹).
| Date | Invoice | Retailer | Area | Product | Qty | Rate | Amount |
|---|---|---|---|---|---|---|---|
| 01-04-2026 | NT-1001 | Sharma Kirana | Vijay Nagar | Atta 10kg | 12 | 420 | 5,040 |
| 01-04-2026 | NT-1002 | Jain General Store | Palasia | Toor Dal 1kg | 30 | 160 | 4,800 |
| 02-04-2026 | NT-1003 | Patel Provision | Rajwada | Sunflower Oil 1L | 48 | 145 | 6,960 |
| 02-04-2026 | NT-1004 | Sharma Kirana | Vijay Nagar | Tea 500g | 10 | 260 | 2,600 |
| 03-04-2026 | NT-1005 | Gupta Mart | Bhawarkuan | Sugar 5kg | 20 | 230 | 4,600 |
| 03-04-2026 | NT-1006 | Jain General Store | Palasia | Atta 10kg | 15 | 420 | 6,300 |
Why Excel Tables beat plain ranges
An Excel Table (Insert > Table, or Ctrl+T) is a named, structured range that grows automatically when you add rows. Formulas typed in one row fill the whole column, filters appear on every header, and pivot tables built on a Table pick up new rows when you refresh.
Tables also give you structured references. Instead of =G2*H2, the Amount column reads like plain English:
=[@Qty]*[@Rate]And a total over the whole column stays correct however many rows you add:
=SUM(Sales[Amount])
→ 30300
Quick check
You add 50 new invoices below an Excel Table. What happens to =SUM(Sales[Amount])?
An Excel Table expands when you add rows directly below it, and structured references always cover the whole column.
Cell references: relative, absolute and mixed
When you copy a formula, Excel shifts its references. =F2*G2 copied one row down becomes =F3*G3. That is a relative reference, and it is what you want for row-by-row calculations.
Sometimes one cell must stay fixed, such as a discount rate in cell K1. Add dollar signs to lock it: $K$1 is an absolute reference. Press F4 while the cursor is on a reference to cycle through K1, $K$1, K$1 and $K1.
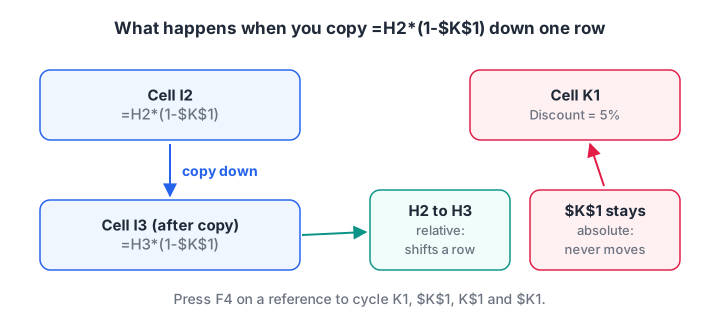
Copying down shifts relative references by one row. The dollar signs keep the discount cell pinned.
=H2*(1-$K$1)        K1 holds 5%
→ 4788 for invoice NT-1001
Mixed references (K$1 or $K1) lock only the row or only the column. You will use them when you build a two-way grid of SUMIFS in the formulas and functions tutorial.
Quick check
Which reference stays exactly the same when you copy a formula down and across?
$K$1 locks both the column and the row. K$1 locks only the row, so it shifts when copied across.
Which Excel version should you learn?
Learn on Microsoft 365. Its dynamic array formulas return many results from one formula, which "spill" into neighbouring cells. Older perpetual licences still run in many Indian offices, so it helps to know what they lack.
| Feature | Microsoft 365 | Excel 2021 / 2024 | Excel 2016 / 2019 |
|---|---|---|---|
| Dynamic arrays (spill) | Yes | Yes | No |
| XLOOKUP, FILTER, UNIQUE, SORT | Yes | Yes | No |
| LET | Yes | Yes | No |
| TEXTSPLIT, TEXTBEFORE, TEXTAFTER | Yes | 2024 only | No |
| IFS, SWITCH, TEXTJOIN | Yes | Yes | 2019 yes, 2016 no |
| Power Query (Get and Transform) | Yes | Yes | Yes |
If a function shows #NAME? on a colleague's laptop, the usual cause is an older version that does not know it. Microsoft's XLOOKUP help page states the versions each function needs.
Excel vs Python, SQL and Power BI
| Tool | Best for | Weak at |
|---|---|---|
| Excel | Quick analysis, reconciliations, small reports up to a few lakh rows | Very large data, repeatable pipelines |
| SQL | Pulling and joining data stored in databases | Formatting and ad hoc what-if work |
| Python (pandas) | Large files, automation, statistics | Sharing with non-technical colleagues |
| Power BI | Interactive dashboards for many viewers | One-off calculations |
A worksheet holds at most 1,048,576 rows, according to Microsoft's published Excel specifications. Long before that limit, a heavy workbook gets slow, which is the usual signal to move the job to Power Query or Python.
To see the overlap, here is the same "filter Palasia, sort by amount" job in pandas. You can run it right here.
import pandas as pd

sales = pd.DataFrame({
    "Invoice": ["NT-1001", "NT-1002", "NT-1003", "NT-1004", "NT-1005", "NT-1006"],
    "Retailer": ["Sharma Kirana", "Jain General Store", "Patel Provision",
                 "Sharma Kirana", "Gupta Mart", "Jain General Store"],
    "Area": ["Vijay Nagar", "Palasia", "Rajwada", "Vijay Nagar", "Bhawarkuan", "Palasia"],
    "Qty": [12, 30, 48, 10, 20, 15],
    "Rate": [420, 160, 145, 260, 230, 420],
})
sales["Amount"] = sales["Qty"] * sales["Rate"]          # like =[@Qty]*[@Rate]

palasia = sales[sales["Area"] == "Palasia"].sort_values("Amount", ascending=False)
print(palasia[["Invoice", "Retailer", "Amount"]].to_string(index=False))
print("Total sales:", sales["Amount"].sum())            # like =SUM(Sales[Amount])
In Excel 365 the same filter is one formula: =SORT(FILTER(Sales, Sales[Area]="Palasia"), 8, -1). The pandas group-by and pivot tables tutorial goes further when you are ready.
The Excel and Macros series: what you will learn
The series has 13 tutorials in two parts, best read in order.
Part 1: Excel for data analysis
- Excel for data analysis (this guide): layout, Tables, references and versions.
- Excel formulas and functions: SUM, AVERAGE, COUNTIFS, SUMIFS and error values.
- IF, IFS, AND and OR: logical tests, discount slabs and flags.
- XLOOKUP vs VLOOKUP vs INDEX MATCH: pulling values from another table.
- Text and date functions: splitting codes, fixing dates, financial years.
- Data cleaning in Excel: duplicates, TRIM, Flash Fill and validation.
- Pivot tables: summaries, grouping, slicers and refresh.
- Charts and a sales dashboard: turning summaries into a one-page report.
- Power Query: importing, cleaning and combining files without formulas.
Part 2: Excel macros and VBA
- Excel macros: recording, running and saving .xlsm files safely.
- VBA basics: variables, loops and the Range object.
- Automating reports with VBA: practical macros for weekly jobs.
- Excel interview questions: what analyst interviews actually ask.
If you would rather learn with a mentor, Debugshala teaches Excel as part of the Data Analytics course at Debugshala, Old Palasia, and you can attend a free demo class first.
Common mistakes beginners make
- Typing totals by hand. A hard-coded 30300 never updates. Always use a formula.
- Merging cells inside the data. Merged cells break sorting, filtering and pivots. Use Center Across Selection for headings instead.
- Mixing units in one column. "12", "12 pcs" and "1 dozen" in the same column cannot be summed.
- Analysing the only copy. Keep the raw export untouched on one sheet and work on a copy.
Key takeaways
- Excel data analysis follows five steps: import, clean, calculate, summarise, present and automate.
- Keep data tidy: one header row, one record per row, no merged cells or blank rows.
- Convert data to an Excel Table with Ctrl+T so formulas and pivots grow with it.
- Use F4 to switch between relative and absolute references.
- Learn on Microsoft 365, and expect #NAME? for new functions in Excel 2016 and 2019.
FAQ
Is Excel enough to become a data analyst?
Excel alone is rarely enough, but it is the skill almost every analyst job expects first. Most roles also ask for SQL and either Power BI or Python. The data analyst roadmap shows a sensible order: Excel and SQL first, then a BI tool, then Python.
How long does it take to learn Excel for data analysis?
Most beginners become comfortable with formulas, lookups and pivot tables in four to six weeks of regular practice, around an hour a day. Macros and VBA take longer. Progress depends far more on working with real messy data than on watching videos.
Which version of Excel is best for data analysis?
Microsoft 365 is best, because it gets new functions such as XLOOKUP, FILTER, UNIQUE and LET first. Excel 2021 and 2024 have most of them. Excel 2016 and 2019 lack dynamic arrays, so some formulas in this series need older alternatives there.
Can I learn data analytics in Indore if I start with Excel?
Yes. Debugshala, an IT training and placement institute at Old Palasia, Indore, teaches Excel in its Data Analytics and BI Tools classroom course in Indore, with offline classes in English and Hindi, and it accepts non-IT graduates. You can join a free demo class before paying anything, and practise aptitude and coding quizzes on Debugshala Test.
From the team behind this site
Go further with the Data Analytics Course at Debugshala
These tutorials are written by Debugshala, a training and placement institute at Old Palasia, Indore. The classroom course adds live mentoring, real projects and interview preparation.
- Offline classes at Old Palasia, Indore
- Free demo class before you pay
- Non-IT, fresher and year-gap friendly
- Placement assistance
700+ students placed · 200+ hiring partners · 4.9★ Google rating
