

Data Analyst Roadmap: How to Become a Data Analyst from Scratch
A step-by-step data analyst roadmap: skills to learn, a six-month timeline, portfolio projects, interview prep and how classroom training in Indore helps.
Think about learning to drive in Indore. Nobody starts on the AB Road flyover at 6 pm. You first learn the controls in an empty ground, then quiet lanes, then busy roads, and only then do you take the licence test.
If you skip the order, you either crash or give up. If you follow it, each step feels manageable because the last one prepared you.
Becoming a data analyst is the same. The empty ground is Excel and basic statistics. The quiet lanes are SQL. Busy roads are Python and real messy data. The licence test is the interview, and your portfolio is the proof that you can actually drive.
A data analyst roadmap is an ordered plan of skills, projects and interview practice that takes you from no experience to being ready for an entry-level analyst job.
The skills a data analyst needs
Job descriptions can list twenty tools, which scares beginners. In practice, a fresher needs depth in a few and awareness of the rest.
| Skill | Why it matters | Enough for a first job |
|---|---|---|
| Excel / Google Sheets | Every business shares data in spreadsheets | Lookups, IF, pivot tables, basic charts |
| Statistics basics | To tell a real change from noise | Mean, median, spread, percentages, simple sampling ideas |
| SQL | Company data lives in databases | Joins, GROUP BY, HAVING, subqueries, a few window functions |
| Python + pandas | Cleaning and repeatable analysis | Reading data, cleaning, groupby, merging, simple charts |
| Power BI or Tableau | Managers consume dashboards | A data model, measures, a clean KPI page |
| Communication | Analysis is useless if nobody acts | A one-page summary with a clear recommendation |
If you are curious about what the job looks like day to day, read what a data analyst does before planning your study time.
A six-month data analyst roadmap, stage by stage
Here is a realistic self-study timeline for someone starting from zero, studying about 10 hours a week. Faster learners and people with a maths or commerce background may move quicker; that is fine.
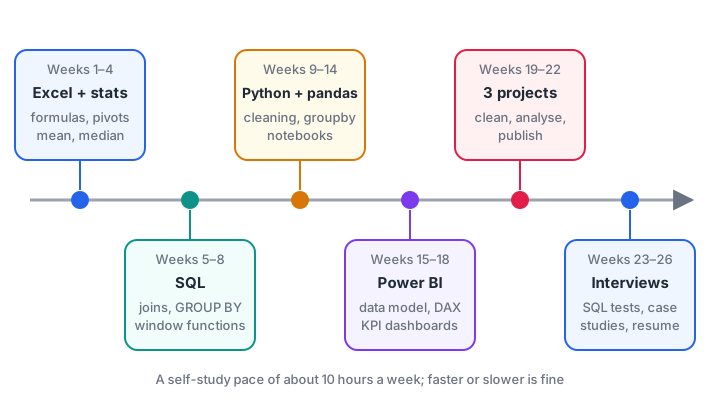
Six stages, each building on the last. The week ranges are a guide for self-study, not a fixed rule.
Stage 1: Excel and statistics (weeks 1–4)
Learn formulas, sorting, filtering, VLOOKUP or XLOOKUP, and pivot tables. Alongside, learn what mean, median, percentage change and standard deviation tell you. Practise on any sheet you have, such as a family budget or a college fest's ticket sales.
Stage 2: SQL (weeks 5–8)
SQL is the single most important skill in analyst interviews. Master SELECT, WHERE, ORDER BY, GROUP BY, HAVING and JOIN, then subqueries and window functions such as ROW_NUMBER. Our SQL for data analysis guide has runnable examples for each.
Stage 3: Python and pandas (weeks 9–14)
Start with Python basics: variables, for loops and if-else. Then move to pandas: reading CSVs, cleaning data, groupby, merge and pivot tables. Work in a notebook so that your steps and results sit together.
Stage 4: Power BI dashboards (weeks 15–18)
Learn to load data, build relationships in a star schema, write basic DAX measures and design one clean KPI page. The principles carry over to Tableau if a job asks for it.
Stage 5: Portfolio projects (weeks 19–22)
Build three projects, described in the next section. This is where everything you have learnt comes together.
Stage 6: Interviews and applications (weeks 23–26)
Prepare a one-page resume, practise SQL questions under time pressure, rehearse your project stories, and start applying. Many people keep applying while still polishing projects, which is sensible.
Portfolio projects that actually get interviews
Recruiters see hundreds of copied projects on the same famous datasets. A project stands out when it answers a specific business question and ends with a recommendation.
- Sales performance analysis (SQL + Excel). Load a retail dataset into a database, answer five business questions with SQL, and summarise findings in a one-page note. Example question: "Which three product categories lost revenue quarter on quarter, and in which regions?"
- Customer retention study (Python + pandas). Clean an orders file, calculate how many customers return each month, and suggest who to target with an offer.
- KPI dashboard (Power BI). Build a dashboard for one imagined manager, with 4 KPIs, a trend, a breakdown and slicers. Write down which decision each visual supports.
Here is the starting point of project 2: a monthly repeat-customer rate from a small orders table.
import pandas as pd

orders = pd.DataFrame({
    "customer": ["A", "B", "C", "A", "D", "B", "E", "A", "C", "F", "D", "G"],
    "month": ["Jan", "Jan", "Jan", "Feb", "Feb", "Feb", "Feb",
              "Mar", "Mar", "Mar", "Mar", "Mar"],
})

months = ["Jan", "Feb", "Mar"]
seen = set()
for m in months:
    buyers = set(orders.loc[orders["month"] == m, "customer"])
    repeat = buyers & seen
    rate = len(repeat) / len(buyers) * 100
    print(f"{m}: {len(buyers)} buyers, {len(repeat)} returning ({rate:.0f}%)")
    seen |= buyers
In March, 3 of 5 buyers had bought before. In a real project, you would run this on thousands of rows, chart the trend, and explain what changed.
Quick check
What makes a portfolio project stand out to recruiters?
Recruiters look for evidence that you can turn data into a decision, which a clear question and recommendation demonstrate.
How to prepare for data analyst interviews
Most entry-level analyst interviews have some mix of these rounds:
- Aptitude and reasoning. Percentages, ratios and logical puzzles, often in a timed online test.
- SQL. Writing queries on a sample schema, frequently involving GROUP BY, joins and "top N per group".
- Excel or Python. A short task such as cleaning a column or building a pivot.
- Case or business question. "Our app's orders fell 10% last week. How would you investigate?"
- Project walk-through and HR. Explain one project clearly, including what went wrong.
"Top N per group" is one of the most common SQL interview patterns. Here it is with a window function, run in Python's built-in SQLite.
import sqlite3
import pandas as pd

con = sqlite3.connect(":memory:")
con.execute("CREATE TABLE sales (city TEXT, product TEXT, revenue INT)")
con.executemany("INSERT INTO sales VALUES (?, ?, ?)", [
    ("Indore", "Tea", 900), ("Indore", "Coffee", 1200), ("Indore", "Juice", 400),
    ("Bhopal", "Tea", 700), ("Bhopal", "Coffee", 300), ("Bhopal", "Juice", 650),
])

query = """
SELECT city, product, revenue
FROM (
    SELECT *, ROW_NUMBER() OVER (PARTITION BY city ORDER BY revenue DESC) AS rn
    FROM sales
)
WHERE rn = 1;
"""
print(pd.read_sql_query(query, con))
Practise explaining each line aloud: the inner query numbers products within each city by revenue, and the outer query keeps only number 1. Interviewers care about that explanation as much as the answer. You can find more timed aptitude and coding practice on Debugshala Test.
For the case question, use a simple structure: clarify the metric, check whether the data is correct, split the change by segment (city, platform, new or repeat customers), form a hypothesis, and say what data would confirm it.
Quick check
Which skill do entry-level data analyst interviews usually test most heavily?
SQL is used daily to pull and summarise data, so most analyst interviews include a dedicated SQL round.
Self-study or a classroom course in Indore?
Both paths work. Self-study is flexible and free but easy to abandon, and you get little feedback on your projects. A classroom course gives you a fixed schedule, a trainer who reviews your SQL and dashboards, and peers to practise interviews with.
If you are in Indore and prefer learning in person, an analyst programme with mentors at Old Palasia such as Debugshala's can follow this same roadmap with guidance. Here is what is relevant to the roadmap:
- DebugShala is a training and placement institute in Indore focused on Data, AI and Full Stack Development.
- Classes are offline at the Old Palasia campus, taught in English and Hindi.
- Courses accept fresh graduates, students from non-IT backgrounds and people with a year gap, and placement assistance is offered.
- You can attend a free demo class before paying anything, so you can judge the teaching style first.
- Related courses include BI Tools, Data Science & AI and Data Engineering, if you later want to go deeper.
Admissions can be reached on +91-8982385539 or info@debugshala.com, and the campus is at 204-208, C.S. Naidu Arcade, Greater Kailash Road, opposite Grotto, Old Palasia.
Common mistakes on the data analyst journey
- Learning tools in random order. Jumping to machine learning before SQL leaves gaps that interviews expose quickly.
- Collecting certificates instead of projects. A certificate says you watched; a project shows you can do the work.
- Copying famous projects unchanged. Pick a different question or dataset, or at least add your own analysis and recommendation.
- Ignoring communication. Practise writing a three-line summary of every analysis you do.
- Waiting to feel "ready". Start applying once you have SQL, one dashboard and two solid projects.
Key takeaways
- Follow an order: Excel and statistics, SQL, Python and pandas, Power BI, projects, interviews.
- At about 10 hours a week, six months is a realistic self-study timeline from scratch.
- Three focused projects, each with a question and a recommendation, beat ten copied ones.
- Prepare for aptitude, SQL, a tool task, a case question and a project walk-through.
- A classroom course adds structure, feedback and placement assistance if you prefer guided learning.
FAQ
Can I become a data analyst without a computer science degree?
Yes. Many analysts come from commerce, arts, science or management backgrounds. Employers mainly check whether you can use SQL, Excel and a dashboard tool to answer business questions, which your portfolio and interview performance demonstrate.
Should I learn Python or SQL first for data analysis?
Learn SQL first. It is simpler to start, it is tested in almost every analyst interview, and it teaches you to think in tables and groups. Python with pandas builds on that thinking and is easier once SQL feels natural.
Is data analytics good for freshers and people with a career gap?
Entry-level analyst roles are a common starting point for freshers, because they reward practical skills you can show in a portfolio. A gap year is easier to explain when you can point to recent projects and a structured learning plan.
How does Debugshala help someone following this roadmap in Indore?
Debugshala offers offline classes at Old Palasia in English and Hindi, accepts fresh graduates, non-IT learners and people with a year gap, and provides placement assistance. If you want guided practice on each stage, explore a classroom-based analytics course with placement assistance and book the free demo class first.
Do I need to learn machine learning to become a data analyst?
Not for most entry-level roles. Analysts mainly use descriptive and diagnostic analysis with SQL, Excel, pandas and dashboards. Basic awareness of machine learning helps if you later want to move towards data science.
From the team behind this site
Go further with the Data Analytics Course at Debugshala
These tutorials are written by Debugshala, a training and placement institute at Old Palasia, Indore. The classroom course adds live mentoring, real projects and interview preparation.
- Offline classes at Old Palasia, Indore
- Free demo class before you pay
- Non-IT, fresher and year-gap friendly
- Placement assistance
700+ students placed · 200+ hiring partners · 4.9★ Google rating
