

Excel Interview Questions for Data Analysts (With Answers)
19 Excel interview questions for data analysts with model answers on references, lookups, pivot tables, Power Query and VBA, plus how to ace the practical test.
Think of an Excel interview like a driving test in Indore traffic. The examiner does not want the parts of a gearbox recited; they want to see you handle the Palasia square roundabout without a scratch.
An Excel interviewer is the same. They hand you a messy sales sheet and watch how you clean it, summarise it and check your answer. The questions are the theory test; the sample file is the road test.
An Excel interview for a data analyst checks whether you can turn raw business data into a correct, explainable summary using formulas, lookups, pivot tables, Power Query and, for some roles, VBA.
This guide assumes Microsoft 365 Excel. Say so when an answer depends on the version: XLOOKUP and FILTER are not in Excel 2016 or 2019.
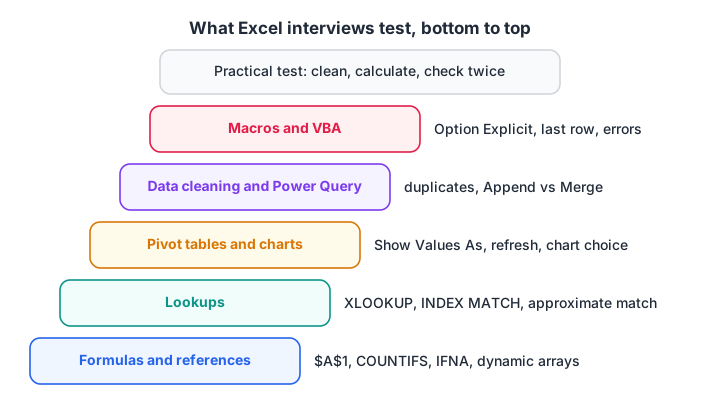
Every analyst interview covers the lower rungs; reporting-heavy roles climb higher.
Excel formula interview questions
1. What is the difference between relative, absolute and mixed references?
A relative reference such as A2 shifts when you copy the formula. An absolute reference $A$2 stays fixed. A mixed reference locks only the column ($A2) or only the row (A$2). Press F4 to cycle through them. Use absolute references for a fixed rate cell, such as a commission % in $H$1.
2. What is the difference between COUNT, COUNTA and COUNTIFS?
COUNT counts cells with numbers, COUNTA counts non-empty cells of any type, and COUNTBLANK counts empty ones. COUNTIFS counts rows meeting several conditions at once.
=COUNTIFS(Orders[Area], "Palasia", Orders[Amount], ">=10000") → 2The full set of aggregation functions is in Excel formulas and functions.
3. What do the common Excel errors mean?
| Error | Usual cause |
|---|---|
#N/A |
Lookup value not found |
#VALUE! |
Wrong data type, such as text in =A2*B2 |
#REF! |
A referenced cell or column was deleted |
#DIV/0! |
Division by zero or an empty cell |
#NAME? |
Misspelt function or missing quotes around text |
#SPILL! |
A dynamic array formula is blocked by cells in its way |
4. When would you use IFERROR versus IFNA?
IFNA catches only #N/A, what a failed lookup returns. IFERROR catches every error, even real bugs such as #REF!. Prefer IFNA, or XLOOKUP's own "if not found" argument.
5. What are dynamic array formulas?
In Microsoft 365, one formula can return many values that "spill" into neighbouring cells. =UNIQUE(Orders[Area]) lists each area once, =SORT() sorts, and =FILTER(Orders, Orders[Amount]>10000) returns matching rows. #SPILL! means something blocks the spill range.
Quick check
A candidate wraps every VLOOKUP in IFERROR(..., 0). What is the main risk?
IFERROR hides every error. IFNA, or XLOOKUP's if_not_found argument, handles missing values while still showing genuine mistakes.
Excel lookup interview questions
6. VLOOKUP, XLOOKUP or INDEX MATCH: which do you use?
XLOOKUP in Microsoft 365, because it looks left or right, defaults to exact match and handles "not found" cleanly. INDEX MATCH for files that must open in Excel 2016 or 2019. VLOOKUP only for legacy sheets: it cannot look left and breaks when someone inserts a column. XLOOKUP vs VLOOKUP vs INDEX MATCH compares them in depth.
7. Why does VLOOKUP return #N/A when the value is clearly there?
Three usual suspects: extra spaces ("AT10 " is not "AT10"), a number stored as text in one table and as a number in the other, or approximate match because the fourth argument was left out. Check with =LEN() and =ISNUMBER(), then fix with TRIM or VALUE.
8. When is an approximate match useful?
For slabs and bands. A distributor pays commission by sales slab: 2% from ₹0, 3% from ₹50,000 and 5% from ₹1,00,000. With the slab table sorted ascending, =XLOOKUP(B2, Slabs[From], Slabs[Rate], , -1) returns the rate for the largest slab not above B2. For ₹72,000 it returns 3%.
Pivot table and chart interview questions
9. What is a pivot table and when do you use one?
A pivot table summarises a large table by dragging fields into Rows, Columns, Values and Filters, with no formulas. Use it for quick totals by area, month or product; see Excel pivot tables and, for charting the result, Excel charts and dashboards.
10. How do you show each area's share of total sales in a pivot table?
Right-click a value and choose Show Values As > % of Grand Total. Difference From shows month-on-month change.
11. Your pivot table does not show the new rows you added. Why?
Pivot tables cache data and need a refresh (Alt+F5, or Ctrl+Alt+F5 for all). If the source was a fixed range like A1:D500, new rows below 500 are outside it. Build pivots from an Excel Table so the source grows automatically.
Data cleaning and Power Query interview questions
12. How do you remove or find duplicates?
Data > Remove Duplicates (destructive, so work on a copy), Conditional Formatting > Highlight Cells Rules > Duplicate Values to see them first, or =UNIQUE() for a clean list. More in data cleaning in Excel.
13. What is Power Query and why use it instead of formulas?
Power Query (Data > Get Data) imports and cleans data through recorded steps that rerun on refresh. It suits repeated monthly cleaning, combining many files and joining large tables, where thousands of formulas would be slow and fragile.
14. What is the difference between Append and Merge in Power Query?
Append stacks tables with the same columns, adding rows (like SQL UNION ALL). Merge joins two tables on a key column, adding columns (like a SQL join). Monthly files are appended; a product master is merged. See Power Query in Excel.
Quick check
Which Power Query command would you use to add product names from a product master to a sales table?
Merge joins two tables on a key such as SKU and adds columns. Append only stacks rows from tables with the same columns.
Excel macros and VBA interview questions
15. What is the difference between a macro and VBA, and how do you save one?
A macro is an automated task; VBA is its language. Workbooks with macros must be saved as .xlsm (or .xlsb); saving as .xlsx removes them. The Excel macros tutorial walks through recording and security.
16. Why use Option Explicit?
It forces every variable to be declared with Dim. A misspelt variable then raises "Variable not defined" at compile time instead of silently holding zero and producing a wrong total.
17. How do you find the last used row in VBA?
lastRow = ws.Cells(ws.Rows.Count, "A").End(xlUp).RowIt starts at the bottom of column A and jumps up to the last filled cell, so blank cells in the middle do not stop it.
18. How do you handle errors in VBA?
Use On Error GoTo Handler, put Exit Sub before the label, and in the handler report Err.Description and restore changed settings. Use On Error Resume Next only around one expected failure, then On Error GoTo 0. Excel VBA basics has a full example.
19. How do you make a slow macro faster?
Turn off Application.ScreenUpdating, set calculation to manual, and restore both in an error-safe exit block. Avoid Select. Five practical VBA macros shows this pattern.
How do you handle the practical Excel test?
Many companies set a short task on a sample file: "Find unique customers per area, the largest order in each area, and flag repeat customers."
Work in this order, and say each step aloud:
- Look before you calculate. Scan for blanks, spaces, text numbers and odd dates.
- Convert to a Table with Ctrl+T so formulas use readable names.
- Calculate, preferring simple, checkable formulas.
- Summarise with a pivot table or a small formula block.
- Check your answer against a total you can verify another way.
For the sample brief, the formulas look like this:
Unique customers, Palasia  =COUNTA(UNIQUE(FILTER(Orders[Customer], Orders[Area]="Palasia")))   → 3
Largest order, Palasia     =MAXIFS(Orders[Amount], Orders[Area], "Palasia")                     → 21500
Repeat customer flag       =IF(COUNTIF(Orders[Customer], [@Customer])>1, "Repeat", "")
If you know Python, you can double-check the same answers with pandas:
import pandas as pd

orders = pd.DataFrame({
    "Area": ["Palasia", "Palasia", "Rajwada", "Palasia", "Rajwada", "Rajwada", "Palasia"],
    "Customer": ["Gupta Kirana", "Jain Stores", "Mehta General", "Gupta Kirana",
                 "Mehta General", "Sharma Provision", "Agrawal Mart"],
    "Amount": [18400, 9600, 7200, 21500, 8800, 14100, 6400],
})

# =COUNTA(UNIQUE(FILTER(Orders[Customer], Orders[Area]="Palasia")))
print("Unique customers per area:")
print(orders.groupby("Area")["Customer"].nunique())

# =MAXIFS(Orders[Amount], Orders[Area], "Palasia")
print("\nLargest order per area:")
print(orders.groupby("Area")["Amount"].max())

# Duplicate check, like COUNTIF(...)>1 used in conditional formatting
dupes = orders[orders.duplicated("Customer", keep=False)]
print("\nCustomers with more than one order:", sorted(dupes["Customer"].unique()))
Both give 3 unique customers in Palasia and 2 in Rajwada, with Gupta Kirana and Mehta General repeating. Saying "I verified this two ways" impresses in any practical test.
Mistakes that cost candidates the job
- Typing numbers over formulas to make totals "look right".
- Not checking whether a lookup returned
#N/Afor some rows.
SQL and Python rounds usually follow, so also prepare with SQL interview questions, and plan the full path with the data analyst roadmap. Timed practice helps: try the aptitude and reasoning quizzes on Debugshala Test. If you prefer a classroom route, Debugshala teaches Excel, macros included, in a placement-assisted analytics course at Debugshala.
Key takeaways
- Prepare five layers: formulas, lookups, pivots and charts, Power Query, and VBA.
- Know the version differences: XLOOKUP, FILTER and UNIQUE need Microsoft 365 or Excel 2021.
- In practical tests, clean first, use a Table, and verify totals two ways.
- For VBA, be ready to discuss Option Explicit, last-row code, error handling and speed.
FAQ
What Excel skills are required for a data analyst job?
Most analyst roles expect confident use of SUMIFS and COUNTIFS, XLOOKUP or INDEX MATCH, IF logic, text and date functions, pivot tables, charts and data cleaning. Power Query is increasingly expected. VBA is a bonus for roles with heavy recurring reports.
How do I prepare for an Excel interview in one week?
Spend two days on formulas and lookups, two on pivot tables and charts, one on Power Query and one on a practice dataset end to end. On the last day, do a timed mock task and explain your steps aloud.
Is VBA asked in data analyst interviews?
Sometimes. Roles in finance, operations and MIS reporting often ask basic VBA: what a macro is, saving as .xlsm, a simple loop, finding the last row and error handling. Many product and tech-company analyst roles focus on SQL and Python instead, and ask only about Excel formulas and pivots.
How can I get interview-ready for analyst jobs in Indore?
Combine Excel with SQL, a BI tool and basic Python. Debugshala teaches Excel within its Data Analytics and BI Tools courses at Old Palasia, Indore, with placement assistance, classes in English and Hindi and a free demo class. Its practice platform, test.debugshala.com, has aptitude and coding quizzes for timed preparation.
From the team behind this site
Go further with the Data Analytics Course at Debugshala
These tutorials are written by Debugshala, a training and placement institute at Old Palasia, Indore. The classroom course adds live mentoring, real projects and interview preparation.
- Offline classes at Old Palasia, Indore
- Free demo class before you pay
- Non-IT, fresher and year-gap friendly
- Placement assistance
700+ students placed · 200+ hiring partners · 4.9★ Google rating
