

Pandas GroupBy and Pivot Tables: Summarise Sales Data Fast
Master pandas groupby, agg, transform, pivot_table and crosstab on a sales dataset, with a clear mapping from Excel pivot tables to pandas code.
Imagine a sweet shop with three outlets in Indore: Sarafa, Vijay Nagar and Palasia. At the end of every month, the owner tips all the bills onto a big table and asks you, "Which outlet earned the most, and which sweet sells best where?"
You would probably sort the bills into three piles, one per outlet. Then you would add up each pile. Finally, you would write the three totals on a single sheet of paper.
That is exactly what pandas does. Sorting into piles is the split. Adding up each pile is the apply. Writing the totals on one sheet is the combine. The column you sorted by (outlet) is the group key, and the addition is the aggregation.
pandas groupby is a split-apply-combine operation: it splits a DataFrame into groups by one or more keys, applies a function such as sum or mean to each group, and combines the answers into a new table.
How split-apply-combine works
Here is the idea on five rows of city sales before we touch the sweet shop data.
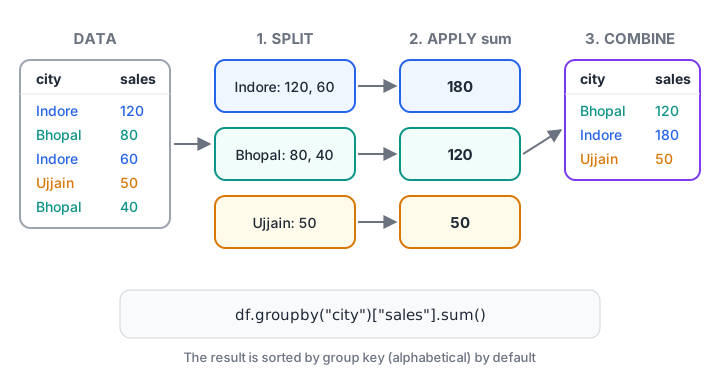
Rows are split by city, each group is summed, and the sums are combined into one result.
Three details are worth remembering:
- The result has one row per group, not one row per original record.
- The group key becomes the index of the result. Use
reset_index()oras_index=Falseif you want it back as a normal column. - Groups are sorted by key by default. Pass
sort=Falseto keep the order in which keys first appear.
If DataFrames are still new to you, the pandas user guide on groupby is the official reference for everything below.
Your first groupby: totals per outlet
This is the sweet shop dataset for January and February. Every block below builds it again so it runs alone.
import pandas as pd

sales = pd.DataFrame({
    "month": ["Jan"] * 6 + ["Feb"] * 6,
    "outlet": ["Sarafa", "Sarafa", "Vijay Nagar", "Vijay Nagar", "Palasia", "Palasia"] * 2,
    "product": ["Kaju Katli", "Namkeen", "Kaju Katli", "Rasgulla", "Namkeen", "Rasgulla"] * 2,
    "qty": [40, 25, 30, 50, 20, 35, 45, 30, 28, 60, 22, 30],
    "revenue": [32000, 5000, 24000, 10000, 4000, 7000,
                36000, 6000, 22400, 12000, 4400, 6000],
})

print(sales.groupby("outlet")["revenue"].sum())
print()
print(sales.groupby("outlet")["revenue"].mean().round(0))
print()
print(sales.groupby("outlet").size())
Sarafa earns the most (79,000 rupees across both months), driven by Kaju Katli. size() counts rows per group, which here means the number of sales records per outlet.
groupby with agg: many summaries at once
Real reports need more than one number per group. agg() with named aggregation lets you pick a column, a function and a clear output name in one line each.
import pandas as pd

sales = pd.DataFrame({
    "month": ["Jan"] * 6 + ["Feb"] * 6,
    "outlet": ["Sarafa", "Sarafa", "Vijay Nagar", "Vijay Nagar", "Palasia", "Palasia"] * 2,
    "product": ["Kaju Katli", "Namkeen", "Kaju Katli", "Rasgulla", "Namkeen", "Rasgulla"] * 2,
    "qty": [40, 25, 30, 50, 20, 35, 45, 30, 28, 60, 22, 30],
    "revenue": [32000, 5000, 24000, 10000, 4000, 7000,
                36000, 6000, 22400, 12000, 4400, 6000],
})

report = (
    sales.groupby(["outlet", "month"], as_index=False, sort=False)
         .agg(total_revenue=("revenue", "sum"),
              total_qty=("qty", "sum"),
              best_sale=("revenue", "max"),
              records=("revenue", "count"))
         .sort_values("total_revenue", ascending=False)
)
print(report.to_string(index=False))
Grouping by two keys gives one row per outlet-month pair. as_index=False keeps both keys as ordinary columns, which is easier to sort, export to Excel, or feed into a chart.
transform: keep every row but add a group number
Sometimes you want each original row to carry its group's total, for example to compute each product's share of its outlet's revenue. transform() returns a result the same length as the original DataFrame.
import pandas as pd

sales = pd.DataFrame({
    "outlet": ["Sarafa", "Sarafa", "Vijay Nagar", "Vijay Nagar", "Palasia", "Palasia"],
    "product": ["Kaju Katli", "Namkeen", "Kaju Katli", "Rasgulla", "Namkeen", "Rasgulla"],
    "revenue": [32000, 5000, 24000, 10000, 4000, 7000],
})

sales["outlet_total"] = sales.groupby("outlet")["revenue"].transform("sum")
sales["share_pct"] = (sales["revenue"] / sales["outlet_total"] * 100).round(1)
print(sales)
In January, Kaju Katli is 86.5% of Sarafa's revenue. That single number tells the owner how dependent that outlet is on one product.
Quick check
Which method adds each group's total to every original row, keeping the DataFrame the same length?
transform() returns one value per original row, so you can compute shares such as revenue divided by the outlet total.
pivot_table: the pandas version of an Excel pivot
A groupby result is long: one row per combination. Managers often prefer a wide grid, with one key down the side and another across the top. pivot_table() builds that grid directly.
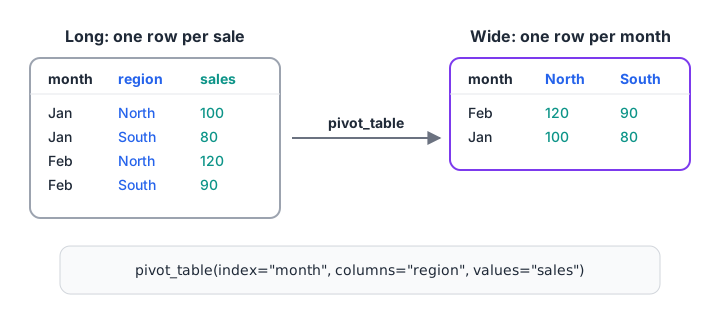
pivot_table moves the values of one column (region) into column headings.
import pandas as pd

sales = pd.DataFrame({
    "month": ["Jan"] * 6 + ["Feb"] * 6,
    "outlet": ["Sarafa", "Sarafa", "Vijay Nagar", "Vijay Nagar", "Palasia", "Palasia"] * 2,
    "product": ["Kaju Katli", "Namkeen", "Kaju Katli", "Rasgulla", "Namkeen", "Rasgulla"] * 2,
    "revenue": [32000, 5000, 24000, 10000, 4000, 7000,
                36000, 6000, 22400, 12000, 4400, 6000],
})

grid = pd.pivot_table(
    sales,
    index="outlet",
    columns="product",
    values="revenue",
    aggfunc="sum",
    fill_value=0,
    margins=True,
    margins_name="Total",
)
print(grid)
fill_value=0 replaces the empty cells (Palasia sells no Kaju Katli), and margins=True adds the row and column totals that Excel calls Grand Total. Change aggfunc to "mean" or "count" to answer different questions with the same layout.
Quick check
In pivot_table, which argument adds a Grand Total row and column like Excel?
margins=True appends totals across rows and columns. margins_name lets you rename the label.
Quick check
Your data has two rows for Sarafa / Kaju Katli in January. Which call handles that without error?
pivot() requires unique index-column pairs, while pivot_table() aggregates duplicates with aggfunc.
crosstab: quick counts and percentages
pd.crosstab() is a shortcut for counting how often combinations occur. With normalize, it turns counts into shares.
import pandas as pd

orders = pd.DataFrame({
    "outlet": ["Sarafa", "Sarafa", "Palasia", "Vijay Nagar", "Sarafa",
               "Palasia", "Vijay Nagar", "Vijay Nagar", "Sarafa", "Palasia"],
    "payment": ["UPI", "Cash", "UPI", "UPI", "UPI",
                "Card", "Cash", "UPI", "UPI", "UPI"],
})

print(pd.crosstab(orders["outlet"], orders["payment"], margins=True))
print()
share = pd.crosstab(orders["outlet"], orders["payment"], normalize="index")
print((share * 100).round(1))
The second table answers "What percentage of each outlet's orders were paid by UPI?" Use normalize="columns" for column shares or normalize="all" for shares of the grand total.
Excel pivot table vs pandas: a mapping
If you already know Excel pivots, you know most of this. Here is how the parts line up.
| Excel pivot table | pandas equivalent |
|---|---|
| Rows area | index= in pivot_table, or the groupby keys |
| Columns area | columns= in pivot_table |
| Values area | values= |
| Summarise values by (Sum, Average, Count) | aggfunc="sum", "mean", "count" |
| Grand Total | margins=True |
| Show empty cells as 0 | fill_value=0 |
| Filters area | Filter first: sales[sales["month"] == "Jan"] |
| Show values as % of row total | pd.crosstab(..., normalize="index"), or divide by a transform("sum") |
| Refresh | Rerun the script |
The biggest advantage of pandas is the last row. When next month's file arrives, you rerun one script instead of rebuilding the pivot by hand. The data usually comes from a SQL query first; see SQL for data analysis for the matching GROUP BY syntax, and clean it first with data cleaning with pandas.
Common mistakes with groupby and pivot tables
- Grouping dirty keys. "Sarafa" and "sarafa " become two groups. Clean text before grouping.
- Forgetting reset_index. A grouped result with the key as index can confuse later merges. Use
as_index=Falseorreset_index(). - Averaging averages. The mean of monthly averages is not the overall average when months have different numbers of sales. Aggregate from raw rows.
- Using count when you mean nunique.
countcounts rows;nuniquecounts distinct values, such as distinct customers. - Missing groups silently. NaN keys are dropped by default. Pass
dropna=Falsetogroupbyif blanks matter.
Key takeaways
- groupby follows split, apply, combine and returns one row per group.
- Named aggregation in
agg()produces several clearly named summaries at once. transform()keeps the original rows and is ideal for shares and comparisons within a group.pivot_table()builds an Excel-style grid with totals;crosstab()is the fastest way to count combinations.- Everything you do in an Excel pivot has a direct pandas equivalent that you can rerun every month.
FAQ
What is the difference between groupby and pivot_table in pandas?
Both summarise data by groups. groupby returns a long result, with one row per group combination, while pivot_table spreads one key across the columns to make a grid. pivot_table is built on top of groupby, so the numbers are the same; only the shape differs.
Can pandas replace Excel pivot tables completely?
For repeated reports and large files, yes, because the script reruns in seconds and keeps a record of every step. Excel remains handy for quick one-off checks and for sharing with people who do not code. Many analysts compute in pandas and export the final grid with to_excel().
How do I group by month when I only have a date column?
Convert the column with pd.to_datetime(), then group by df["date"].dt.to_period("M") or by df["date"].dt.month. The first keeps year and month together, which avoids mixing January 2025 with January 2026.
Where can I learn pandas and Excel pivots together in Indore?
Debugshala teaches Excel, SQL, Python and pandas in offline classes at its Old Palasia campus, in English and Hindi. Debugshala's placement-oriented analytics training accepts non-IT and fresh graduates and starts with a free demo class. You can also take practice MCQs on Debugshala Test between sessions.
From the team behind this site
Go further with the Data Analytics Course at Debugshala
These tutorials are written by Debugshala, a training and placement institute at Old Palasia, Indore. The classroom course adds live mentoring, real projects and interview preparation.
- Offline classes at Old Palasia, Indore
- Free demo class before you pay
- Non-IT, fresher and year-gap friendly
- Placement assistance
700+ students placed · 200+ hiring partners · 4.9★ Google rating
