

What Does a Data Analyst Do? Daily Work, Tools and Examples
See what a data analyst does each day, the four types of analytics, the tools used (Excel, SQL, Python, Power BI) and a runnable sales case study.
Imagine your uncle runs a saree shop near Rajwada. He writes every sale in a thick register: date, customer name, what they bought and how much they paid. One Monday he says, "Diwali was great, but March feels slow. Should I order less silk for April?"
He does not want a lecture on statistics. He wants a clear answer and a suggestion.
So you open the register, add up sales for each month, and notice that March is down by a quarter. You then split the sales by old and new customers and find that almost all the drop comes from regulars who stopped coming. Your suggestion: send those regulars a small festive offer on WhatsApp before ordering less stock.
You have just done a data analyst's job from start to finish.
The register is the dataset. Each line in it is a row, and each heading (date, amount) is a column. Your uncle's worry is the business question. The split by old and new customers is the analysis, and your WhatsApp suggestion is the insight or recommendation.
A data analyst collects, cleans and studies data to answer a specific business question, and then explains the answer clearly enough that someone can make a decision from it.
What a data analyst does on a typical day
Very few days look identical, but most requests move through the same five steps.
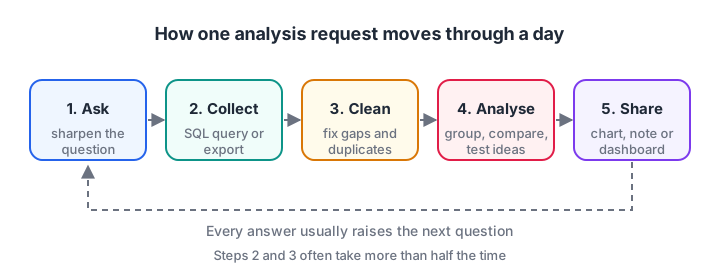
One analysis request, from a vague question to a shared answer, and back to a new question.
- Ask. A manager says "sales are down". You turn that into something measurable: "Which product categories lost the most revenue between February and March, and in which stores?"
- Collect. You pull the rows you need, usually with a SQL query on the company database, sometimes from an Excel export or a Google Sheet.
- Clean. Real data is messy. Dates come in three formats, a store name is spelt two ways, some amounts are blank. Fixing this often takes more than half the time.
- Analyse. You group, compare and filter: revenue by month, by store, by customer type. You check whether a pattern is real or just one unusual week.
- Share. You send a short note with one or two charts, or update a dashboard that the team checks every morning.
A typical inbox for an analyst at an e-commerce company in Indore might contain: "Why did app sign-ups fall last Tuesday?", "Which pin codes have the most returns?" and "Can you make the weekly sales report automatic?"
Who the analyst works with
Analysts sit between the people who own the data and the people who make decisions. On one day you may talk to a marketing manager about a campaign, ask a developer which table stores refunds, and present numbers to a finance head. Clear writing and a calm explanation matter as much as formulas.
The four types of analytics, explained with one example
Every question an analyst answers falls into one of four types. They build on each other, like steps on a ladder.
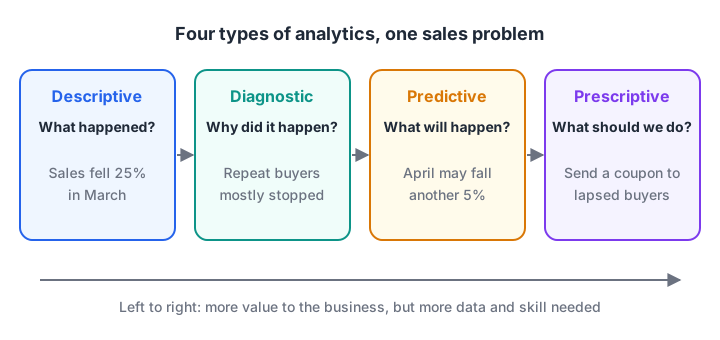
The same March sales problem, seen through each type of analytics.
Descriptive analytics answers "What happened?" Monthly revenue, the number of orders, the average bill value. This is the bulk of reporting work, and it must be correct before anything else matters.
Diagnostic analytics answers "Why did it happen?" You break the total into parts (by city, by product, by customer type) until one part explains most of the change.
Predictive analytics answers "What is likely to happen next?" At the simplest level, it is a trend line. At a more advanced level, it is a machine learning model. Many analysts do light forecasting, while data scientists handle the heavier models.
Prescriptive analytics answers "What should we do?" You compare options, such as offering a coupon or cutting stock, and estimate the result of each.
| Type | Question | Typical technique | Common tool |
|---|---|---|---|
| Descriptive | What happened? | Sums, counts, averages | Excel, SQL |
| Diagnostic | Why? | Grouping, filtering, comparing segments | SQL, pandas |
| Predictive | What next? | Trends, simple forecasts | Python, Excel |
| Prescriptive | What to do? | Scenario comparison, cost vs benefit | Python, Excel |
Quick check
A manager asks, "Which stores caused last month's drop in revenue?" Which type of analytics is this?
The drop has already been measured. Finding which stores explain it is a "why" question, which is diagnostic analytics.
Tools a data analyst uses: Excel, SQL, Python and Power BI
You do not need twenty tools. Four cover most job descriptions you will see.
Excel or Google Sheets is where quick checks happen. Formulas, filters and pivot tables answer many small questions in minutes, and almost every business shares data in spreadsheets.
SQL is how you ask a database for rows. Company data lives in databases with millions of rows, and SQL lets you filter and summarise them before they ever reach your laptop. Our SQL for data analysis tutorial covers the commands you will use daily.
Python with pandas handles cleaning and analysis that would be painful in Excel: joining files, fixing thousands of messy values, and repeating the same report every week with one click. If you have never written Python, start with your first Python program.
Power BI (or Tableau) turns the final numbers into interactive dashboards that managers open themselves. You will see how to plan one in KPI dashboard design with Power BI.
Mini case study: why did March sales drop?
Let us replay the saree shop story with real code. The data below has 15 orders across three months. Each order has the month, whether the customer was new or a repeat buyer, and the amount in rupees.
First, descriptive analytics: what happened to monthly revenue?
import pandas as pd

orders = pd.DataFrame({
    "month": ["Jan"] * 5 + ["Feb"] * 5 + ["Mar"] * 5,
    "customer": ["new", "repeat", "repeat", "new", "repeat",
                 "repeat", "new", "repeat", "repeat", "new",
                 "new", "repeat", "new", "new", "new"],
    "amount": [1200, 2500, 1800, 900, 2100,
               2600, 1100, 1900, 2300, 1000,
               1300, 2000, 1250, 950, 1150],
})

monthly = orders.groupby("month", sort=False)["amount"].sum()
print(monthly)

change = (monthly["Mar"] - monthly["Feb"]) / monthly["Feb"] * 100
print(f"\nFeb to Mar change: {change:.1f}%")
Revenue fell from 8,900 to 6,650 rupees, about 25%. That is the "what". It does not tell the owner what to do yet.
Next, diagnostic analytics: split the same total by customer type.
import pandas as pd

orders = pd.DataFrame({
    "month": ["Jan"] * 5 + ["Feb"] * 5 + ["Mar"] * 5,
    "customer": ["new", "repeat", "repeat", "new", "repeat",
                 "repeat", "new", "repeat", "repeat", "new",
                 "new", "repeat", "new", "new", "new"],
    "amount": [1200, 2500, 1800, 900, 2100,
               2600, 1100, 1900, 2300, 1000,
               1300, 2000, 1250, 950, 1150],
})

split = orders.pivot_table(index="month", columns="customer",
                           values="amount", aggfunc="sum", sort=False)
print(split)
print("\nRepeat-buyer orders per month:")
print(orders[orders["customer"] == "repeat"].groupby("month", sort=False).size())
Now the story is clear. New-customer revenue actually grew in March (2,100 to 4,650), while repeat-customer revenue collapsed from 6,800 to 2,000. Only one repeat order came in. The shop is still attracting people, but its regulars stopped returning.
Finally, a small prescriptive step. Suppose the shop has 40 regulars who did not buy in March, they usually spend about 2,200 rupees, and the owner is considering a 10% discount coupon. You do not know how many will respond, so you test a few rates.
lapsed_customers = 40
avg_spend = 2200
discount = 0.10

for response_rate in [0.10, 0.20, 0.30]:
    buyers = lapsed_customers * response_rate
    revenue = buyers * avg_spend
    coupon_cost = revenue * discount
    print(f"{response_rate:.0%} respond -> {buyers:.0f} buyers, "
          f"revenue Rs {revenue:,.0f}, coupon cost Rs {coupon_cost:,.0f}")
Even at a 10% response, the coupon brings back about 8,800 rupees of sales for 880 rupees of discount. The note you would send the owner is three lines long:
March revenue fell 25%, almost entirely from repeat customers (6,800 -> 2,000).
New customers grew, so footfall is not the problem.
Suggest a 10% WhatsApp coupon for the 40 lapsed regulars before cutting April stock.
That short note is the real product of a data analyst. The code is only how you got there.
Quick check
In the case study, why was "revenue fell 25%" not enough on its own?
Splitting by customer type revealed that repeat buyers stopped returning, which pointed directly to a coupon for lapsed regulars.
Common mistakes new data analysts make
- Starting with the tool instead of the question. Opening Power BI before you know what decision the chart supports leads to pretty but useless dashboards.
- Trusting raw data. One duplicated order or a blank amount can swing a small total by 20%. Clean first; see data cleaning with pandas.
- Reporting only totals. "Sales fell 25%" is descriptive. Managers need the diagnostic part: where and why.
- Confusing correlation with cause. Two numbers rising together does not prove one caused the other. Say "linked with" unless you have tested it.
- Burying the answer. Put the conclusion in the first line of your note, then the evidence.
Key takeaways
- A data analyst answers business questions with data and explains the answer in plain language.
- Daily work follows ask, collect, clean, analyse and share, and cleaning often takes the most time.
- Descriptive and diagnostic analytics are the core of the job; predictive and prescriptive work grows with experience.
- Excel, SQL, Python and Power BI cover most analyst job descriptions.
- The final output is a decision-ready note or dashboard, not a notebook full of code.
FAQ
Do I need to know coding to become a data analyst?
You need some, but less than a software developer. SQL is expected in almost every analyst interview, and basic Python with pandas is increasingly common. Excel and Power BI need little or no coding, so many people start there and add SQL and Python step by step.
Is data analytics a good career for someone from a non-IT background?
Yes, many analysts come from commerce, economics, science or management degrees. Domain knowledge, such as understanding how a shop or a bank earns money, helps you ask better questions. The technical tools can be learnt with regular practice.
What is the difference between a data analyst and a data scientist?
A data analyst mainly explains what happened and why, using SQL, spreadsheets and dashboards. A data scientist spends more time building predictive models with machine learning. The two roles overlap, and many people move from analyst to data scientist after a few years.
Where can I learn data analytics in Indore with classroom teaching?
Debugshala runs offline classes at its Old Palasia campus in Indore, with teaching in English and Hindi. Debugshala's data analytics course in Indore accepts fresh graduates, non-IT students and people with a year gap, offers placement assistance, and has a free demo class before you pay anything.
How can I practise analytics questions for free?
Rebuild the case study above with your own numbers, then try aptitude and reasoning questions, which many analyst interviews include. You can practise aptitude and coding quizzes on Debugshala Test to build speed for written rounds.
From the team behind this site
Go further with the Data Analytics Course at Debugshala
These tutorials are written by Debugshala, a training and placement institute at Old Palasia, Indore. The classroom course adds live mentoring, real projects and interview preparation.
- Offline classes at Old Palasia, Indore
- Free demo class before you pay
- Non-IT, fresher and year-gap friendly
- Placement assistance
700+ students placed · 200+ hiring partners · 4.9★ Google rating
