

Excel Formulas and Functions: SUM, AVERAGE, COUNTIFS, SUMIFS
Excel formulas and functions explained with a distributor's sales sheet: SUM, AVERAGE, COUNT, SUMIFS, COUNTIFS, wildcards, date criteria and error values.
Think of the owner of Narmada Traders sitting with a printed invoice list and a calculator. To find Palasia's sales, she runs a pencil down the Area column, ticks every Palasia row, then adds up the ticked amounts. For "oil orders above ₹4,000" she ticks twice: once for the product, once for the amount.
Excel does exactly that ticking and adding, except it never loses its place and it redoes the work instantly when one invoice changes.
The pencil ticks are the criteria. The column you tick against is the criteria range, and the column you add up is the sum range. Put those three into a function and you have SUMIFS.
An Excel formula is an expression that begins with an equals sign and calculates a value; an Excel function is a built-in, named formula, such as SUM or COUNTIFS, that takes arguments and returns a result.
This tutorial uses the Narmada Traders sales Table from the Excel for data analysis guide, now with ten invoices and a Category column. The Table is named Sales, and amounts are in rupees.
| Date | Invoice | Retailer | Area | Product | Category | Qty | Rate | Amount |
|---|---|---|---|---|---|---|---|---|
| 01-04-2026 | NT-1001 | Sharma Kirana | Vijay Nagar | Atta 10kg | Staples | 12 | 420 | 5040 |
| 01-04-2026 | NT-1002 | Jain General Store | Palasia | Toor Dal 1kg | Staples | 30 | 160 | 4800 |
| 02-04-2026 | NT-1003 | Patel Provision | Rajwada | Sunflower Oil 1L | Oil | 48 | 145 | 6960 |
| 02-04-2026 | NT-1004 | Sharma Kirana | Vijay Nagar | Tea 500g | Beverages | 10 | 260 | 2600 |
| 03-04-2026 | NT-1005 | Gupta Mart | Bhawarkuan | Sugar 5kg | Staples | 20 | 230 | 4600 |
| 03-04-2026 | NT-1006 | Jain General Store | Palasia | Atta 10kg | Staples | 15 | 420 | 6300 |
| 04-04-2026 | NT-1007 | Khan Stores | Sudama Nagar | Sunflower Oil 1L | Oil | 24 | 145 | 3480 |
| 04-04-2026 | NT-1008 | Patel Provision | Rajwada | Tea 500g | Beverages | 18 | 260 | 4680 |
| 05-04-2026 | NT-1009 | Gupta Mart | Bhawarkuan | Atta 10kg | Staples | 8 | 420 | 3360 |
| 05-04-2026 | NT-1010 | Sharma Kirana | Vijay Nagar | Sunflower Oil 1L | Oil | 36 | 145 | 5220 |
What is the difference between a formula and a function?
A formula is anything you type that starts with =. =G2*H2 is a formula with no function in it. A function is a named tool you call inside a formula, such as SUM or ROUND.
Most real formulas combine both: =ROUND(SUM(Sales[Amount])/10, 0) uses two functions, an operator and a constant.
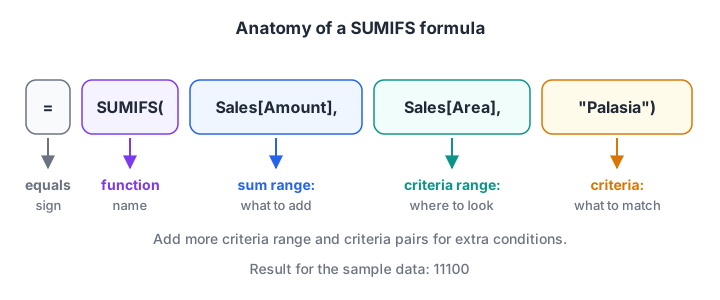
Every argument sits between the brackets, separated by commas. In SUMIFS the column you add always comes first.
Operators and order of calculation
Excel follows the usual maths order: brackets first, then ^, then * and /, then + and -. So =1+2*3 returns 7, while =(1+2)*3 returns 9.
Two more operators matter for analysis. & joins text (="NT-"&1001 gives NT-1001), and the comparison operators =, <>, >, <, >= and <= return TRUE or FALSE.
Basic summary functions: SUM, AVERAGE, MIN, MAX and COUNT
These five functions answer "how much, how many, how big" for a whole column.
=SUM(Sales[Amount])        → 47040
=AVERAGE(Sales[Amount])    → 4704
=MAX(Sales[Amount])        → 6960
=MIN(Sales[Amount])        → 2600
=SUM(Sales[Qty])           → 221
The COUNT family is easy to mix up, so learn the difference once:
| Function | Counts | Example result |
|---|---|---|
COUNT |
Cells that contain numbers | =COUNT(Sales[Qty]) → 10 |
COUNTA |
Cells that are not empty (text or numbers) | =COUNTA(Sales[Retailer]) → 10 |
COUNTBLANK |
Empty cells | =COUNTBLANK(Sales[Qty]) → 0 |
COUNTIF / COUNTIFS |
Cells that meet one or more conditions | see below |
If COUNT on a number column returns less than COUNTA, some "numbers" are really text. The data cleaning tutorial shows how to fix that.
ROUND, and why display is not value
Formatting a cell to show no decimals only changes what you see. The underlying value keeps every decimal and feeds into later totals. Use ROUND when the number itself must change.
=ROUND(AVERAGEIFS(Sales[Amount], Sales[Category], "Staples"), -2)
→ 4800            (4820 rounded to the nearest hundred)
Quick check
COUNT(Sales[Qty]) returns 8 but COUNTA(Sales[Qty]) returns 10. What is the most likely cause?
COUNT counts only numeric cells, while COUNTA counts any non-empty cell. Numbers stored as text are counted by COUNTA but not by COUNT.
How do SUMIFS and COUNTIFS work?
SUMIFS adds the values in one column for the rows where every condition is true. COUNTIFS counts those rows, and AVERAGEIFS averages them. Microsoft's SUMIFS reference lists the full syntax.
=SUMIFS(sum_range, criteria_range1, criteria1, [criteria_range2, criteria2], ...)
=COUNTIFS(criteria_range1, criteria1, [criteria_range2, criteria2], ...)
Read it in plain words: "add up Amount where Area is Vijay Nagar and Category is Staples."
=SUMIFS(Sales[Amount], Sales[Area], "Vijay Nagar", Sales[Category], "Staples")
→ 5040
Only invoice NT-1001 meets both conditions. The other two Vijay Nagar rows are Tea and Oil, so they fail the second test.
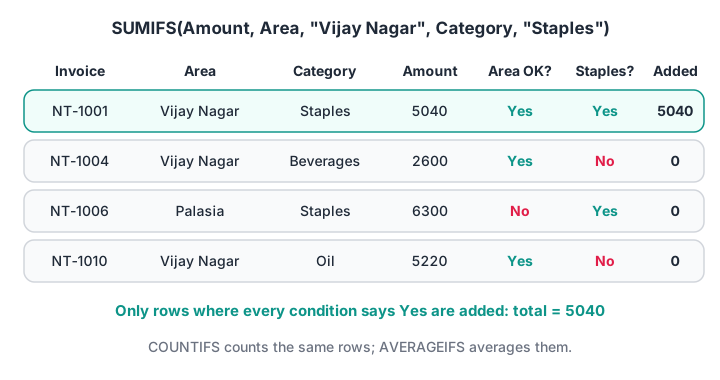
SUMIFS checks every row against every condition. A row is added only when all the ticks line up.
Comparison criteria
Put the operator inside quotes. "Oil orders above ₹4,000" becomes:
=COUNTIFS(Sales[Category], "Oil", Sales[Amount], ">4000")    → 2
=SUMIFS(Sales[Amount], Sales[Category], "Oil", Sales[Amount], ">4000")    → 12180
Criteria from a cell
Hard-coding "Palasia" means editing the formula for every area. Type the area in a cell instead, say K2, and join the operator with & when you need one.
=SUMIFS(Sales[Amount], Sales[Area], K2)              K2 = Palasia  → 11100
=COUNTIFS(Sales[Amount], ">="&L1)                    L1 = 5000     → 4
Date ranges
To total a date range, use two conditions on the same column. Build the dates with DATE(year, month, day) so the formula works whatever the computer's date format.
=SUMIFS(Sales[Amount], Sales[Date], ">="&DATE(2026,4,3), Sales[Date], "<="&DATE(2026,4,4))
→ 19060
Wildcards
* matches any run of characters and ? matches exactly one. Every store with "Kirana" in its name:
=SUMIFS(Sales[Amount], Sales[Retailer], "*Kirana*")    → 12860
=COUNTIFS(Sales[Product], "Sunflower*")                → 3
Quick check
Which formula totals Amount for Oil sales in Rajwada?
SUMIFS takes the sum range first, then pairs of criteria range and criteria. With the sample data it returns 6960.
Build a summary table with UNIQUE and SUMIFS
In Microsoft 365 a formula can return a list that spills into the cells below. Two formulas give you a complete sales-by-area report that updates itself.
K2:  =SORT(UNIQUE(Sales[Area]))
L2:  =SUMIFS(Sales[Amount], Sales[Area], K2#)
The # after K2 means "the whole spilled list", so L2 spills too:
| Area | Sales (₹) |
|---|---|
| Bhawarkuan | 7960 |
| Palasia | 11100 |
| Rajwada | 11640 |
| Sudama Nagar | 3480 |
| Vijay Nagar | 12860 |
In Excel 2016 or 2019, which have no spill, type the area names by hand and copy an ordinary =SUMIFS(Sales[Amount], Sales[Area], K2) down. For bigger summaries, a pivot table is faster to build.
Name a step with LET
LET (Microsoft 365 and Excel 2021 onward) lets you name a piece of a formula and reuse it. It makes long formulas readable.
=LET(total, SUM(Sales[Amount]),
     oil,   SUMIFS(Sales[Amount], Sales[Category], "Oil"),
     oil / total)
→ 0.3329   (format as % to show 33.3%)
The same SUMIFS in pandas
If you also use Python, each SUMIFS is a filter followed by a sum, and the UNIQUE plus SUMIFS report is a groupby. This block reproduces the results above.
import pandas as pd

sales = pd.DataFrame({
    "Area": ["Vijay Nagar", "Palasia", "Rajwada", "Vijay Nagar", "Bhawarkuan",
             "Palasia", "Sudama Nagar", "Rajwada", "Bhawarkuan", "Vijay Nagar"],
    "Category": ["Staples", "Staples", "Oil", "Beverages", "Staples",
                 "Staples", "Oil", "Beverages", "Staples", "Oil"],
    "Amount": [5040, 4800, 6960, 2600, 4600, 6300, 3480, 4680, 3360, 5220],
})

# =SUMIFS(Amount, Area, "Vijay Nagar", Category, "Staples")
mask = (sales["Area"] == "Vijay Nagar") & (sales["Category"] == "Staples")
print("SUMIFS:", sales.loc[mask, "Amount"].sum())

# =COUNTIFS(Category, "Oil", Amount, ">4000")
print("COUNTIFS:", ((sales["Category"] == "Oil") & (sales["Amount"] > 4000)).sum())

# =SORT(UNIQUE(Area)) with SUMIFS beside it
print(sales.groupby("Area")["Amount"].sum())
The pandas group-by tutorial covers this pattern in depth.
Excel error values and what they mean
Errors are messages, not failures. Each one points to a specific cause.
| Error | Usual cause | Typical fix |
|---|---|---|
#DIV/0! |
Dividing by zero or an empty cell | Check the divisor, or wrap in IFERROR |
#N/A |
A lookup found no match | Check spelling and spaces in the key |
#VALUE! |
Text used where a number is expected | Convert text to numbers |
#REF! |
A referenced cell was deleted | Undo, or rewrite the reference |
#NAME? |
Misspelt function, or one your version lacks | Check the name and Excel version |
#SPILL! |
A spilling formula is blocked by data | Clear the cells below or to the right |
You will learn to catch #N/A and #DIV/0! gracefully with IFERROR in the IF, IFS, AND and OR tutorial.
Common mistakes with SUMIFS and COUNTIFS
- Different-sized ranges. Every criteria range must be the same size as the sum range, or SUMIFS returns
#VALUE!. Using Table columns avoids this. - Quotes around a cell reference.
">=L1"compares with the text "L1". Write">="&L1. - Hidden spaces. "Palasia " with a trailing space does not match "Palasia". Clean the data first.
- Using SUMIF's argument order with SUMIFS. In SUMIF the sum range comes last; in SUMIFS it comes first. Stick to SUMIFS for everything.
Key takeaways
- A formula starts with
=; a function is a named tool used inside it. - SUM, AVERAGE, MIN, MAX and the COUNT family summarise whole columns.
- SUMIFS, COUNTIFS and AVERAGEIFS summarise only rows where every condition is true.
- Put operators in quotes and join cell values with
&:">="&L1. - In Microsoft 365,
UNIQUEplusSUMIFSwith#builds a self-updating summary.
FAQ
What is the difference between SUMIF and SUMIFS in Excel?
SUMIF accepts one condition and puts the sum range last. SUMIFS accepts up to 127 conditions and puts the sum range first. SUMIFS does everything SUMIF does, so most analysts use SUMIFS everywhere to avoid mixing up the argument order.
How do I use COUNTIFS with multiple criteria?
Add pairs of range and criteria, separated by commas: =COUNTIFS(Sales[Category],"Oil",Sales[Amount],">4000"). A row is counted only when every pair is true. For "either A or B", add two COUNTIFS together instead, as long as no row can match both.
Why does my SUMIFS return 0 when the data is there?
The usual causes are extra spaces in the text, numbers or dates stored as text, or a criteria typo such as "Plasia". Test with =COUNTIFS(range, criteria). If that is also 0, the match is failing, so clean the column with TRIM and VALUE.
Which Excel functions should a data analyst learn first?
Start with SUM, AVERAGE, COUNTIFS, SUMIFS, IF, XLOOKUP and ROUND, then text and date functions. Those cover most daily reporting work. After that, learn pivot tables and Power Query. Debugshala teaches these Excel functions in its Data Analytics classes for non-IT learners.
Where can I practise Excel formulas for interviews?
Rebuild every example in this tutorial on your own data, then change one condition and predict the answer before pressing Enter. For timed aptitude and logic questions that interviews also include, try the quizzes on Debugshala Test. The Excel interview questions guide lists typical formula tasks.
From the team behind this site
Go further with the Data Analytics Course at Debugshala
These tutorials are written by Debugshala, a training and placement institute at Old Palasia, Indore. The classroom course adds live mentoring, real projects and interview preparation.
- Offline classes at Old Palasia, Indore
- Free demo class before you pay
- Non-IT, fresher and year-gap friendly
- Placement assistance
700+ students placed · 200+ hiring partners · 4.9★ Google rating
