

TallyPrime Reports: Day Book, Trial Balance, P&L, Balance Sheet
Read TallyPrime reports with a worked month: Day Book, ledger, Trial Balance, Profit & Loss A/c and Balance Sheet, plus the keys to filter, detail and export.
Think of a cricket match scorecard. The ball-by-ball commentary records every delivery. The batting card sums up each batter's runs. The final result says who won, and the series table shows where each team stands.
Nobody writes the batting card separately; it comes from the ball-by-ball record. If the commentary is right, every summary is right.
TallyPrime reports work the same way. The vouchers are the ball-by-ball record. The Day Book replays them, ledgers sum them per account, the Trial Balance checks the totals, and the Profit & Loss A/c and Balance Sheet give the final result.
TallyPrime reports are statements calculated automatically from recorded vouchers, ranging from the Day Book of daily entries to the Trial Balance, Profit & Loss A/c and Balance Sheet.
You will read the July 2026 books of Narmada Traders, the made-up Indore wholesaler whose seven vouchers you entered in voucher entry.
How are TallyPrime reports organised?
Reports build on each other, from the most detailed to the most summarised. Learning them in this order makes each one easier to read.
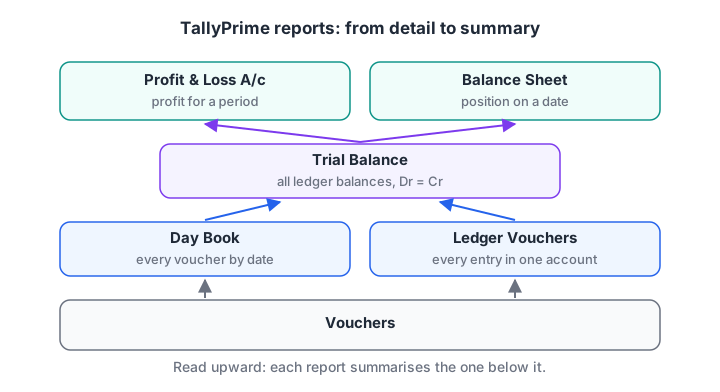
Each report summarises the one below it. If a final figure looks wrong, drill down until you reach the voucher.
You open reports in three ways:
- From the Gateway of Tally. Day Book, Balance Sheet, Profit & Loss A/c and Stock Summary sit on the main screen. Everything else is under Display More Reports.
- With Alt+G (Go To). Type a few letters of the report name and press Enter. This works from any screen.
- By drilling down. In a summary report, select a line and press Enter to open the detail behind it, down to a single voucher.
A few keys that work in every report
TallyPrime uses the same buttons across reports, so learn them once.
| Key | What it does |
|---|---|
| F2 | Change the date or period |
| Alt+F5 | Switch between condensed and detailed views |
| F12 (Configure) | Show or hide columns and options |
| Ctrl+B (Basis of Values) | Change what values are included, such as stock valuation |
| Alt+N (Auto Column) | Add columns, for example one per month or quarter |
| Alt+E / Alt+P / Alt+M | Export, print or share the report |
| Esc | Go back one level |
How to read the Day Book in TallyPrime
The Day Book lists every voucher in date order. It is the first report to check at the end of each day, because it shows exactly what was entered.
- Go to Gateway of Tally > Day Book, or press Alt+G and type "Day Book".
- It opens on the current date shown on the Gateway. Press F2 and set the period 1-7-2026 to 31-7-2026.
- Press Alt+F5 for the detailed view, which shows both sides of each voucher.
- Press F4 to show only one voucher type, such as Sales. Press Ctrl+F to filter, for example by amount.
- Press F12 to show narrations, which helps when you review someone else's work.
For Narmada Traders, the July Day Book shows seven vouchers: two sales, one purchase, one payment, one receipt, one contra and one journal. If an entry is missing or on the wrong date, it shows up here first.
How to view a ledger account
To see every transaction in one account, open Ledger Vouchers: press Alt+G, type "Ledger Vouchers" and pick the ledger. The menu path is Display More Reports > Account Books > Ledger.
Sharma Kirana Store's July ledger reads:
| Date | Particulars | Debit (₹) | Credit (₹) |
|---|---|---|---|
| Opening Balance | 18,500 | ||
| 1-7-2026 | Sales | 27,200 | |
| 2-7-2026 | Bank of Baroda A/c (receipt) | 18,500 | |
| Closing Balance | 27,200 Dr |
Sharma still owes ₹27,200: the 1 July bill. Press F12 and turn on a running balance if you want the balance after each line.
How to read the Trial Balance in TallyPrime
The Trial Balance lists the closing balance of every ledger with debits on one side and credits on the other. If both totals match, every voucher was entered with equal debits and credits.
- Go to Gateway of Tally > Display More Reports > Trial Balance, or Alt+G and "Trial Balance".
- It opens as on the date of the last voucher. Change the period with F2 if needed.
- It shows groups by default. Press F5 to switch to a ledger-wise list, or Alt+F5 for the detailed view.
- Press F12 and turn on Show Opening Balance or Show Transactions to see the full movement.
Narmada Traders on 31 July 2026, ledger-wise. The opening stock is shown as one line, as it would appear in a hand-drawn trial balance:
| Ledger | Debit (₹) | Credit (₹) |
|---|---|---|
| Ramesh Patel Capital | 4,00,000 | |
| Malwa Dal Mill | 1,02,000 | |
| Indore Roadways | 2,000 | |
| Sales | 33,000 | |
| Bank of Baroda A/c | 2,51,500 | |
| Cash | 10,800 | |
| Sharma Kirana Store | 27,200 | |
| Opening Stock | 1,73,500 | |
| Purchase | 60,000 | |
| Shop Rent | 12,000 | |
| Freight Inward | 2,000 | |
| Total | 5,37,000 | 5,37,000 |
Quick check
Which TallyPrime report lists every voucher entered for a chosen day or period?
The Day Book lists vouchers in date order. The Trial Balance and Balance Sheet show balances, not individual vouchers.
How to read the Profit & Loss A/c
The Profit & Loss A/c compares income and expenses for a period. Ledgers under the six revenue groups (Sales, Purchase, Direct and Indirect Incomes and Expenses) appear here, along with opening and closing stock.
- Gateway of Tally > Profit & Loss A/c, or Alt+G.
- Press F2 to set the period: 1-7-2026 to 31-7-2026.
- Press Alt+F5 for detail. In F12, Show Vertical Profit & Loss switches to a top-to-bottom layout, and Show Percentages shows each line as a share of sales.
TallyPrime's default horizontal layout works out gross profit first (trading items) and then net profit.
| Debit side | ₹ | Credit side | ₹ |
|---|---|---|---|
| Opening Stock | 1,73,500 | Sales Accounts | 33,000 |
| Purchase Accounts | 60,000 | Closing Stock | 2,04,500 |
| Direct Expenses (Freight Inward) | 2,000 | ||
| Gross Profit c/o | 2,000 | ||
| 2,37,500 | 2,37,500 | ||
| Indirect Expenses (Shop Rent) | 12,000 | Gross Profit b/f | 2,000 |
| Net Loss | 10,000 |
Read it like this. The 10 bags sold had cost ₹29,000 (8 × ₹3,000 + 2 × ₹2,500) and sold for ₹33,000, a ₹4,000 margin.
Freight of ₹2,000 cut gross profit to ₹2,000, and ₹12,000 rent turned it into a ₹10,000 loss. One slow month of sales can't carry a full month's rent: that is the insight a P&L gives you.
Press Alt+N (Auto Column) and choose Quarterly or Monthly to compare periods side by side once you have more data.
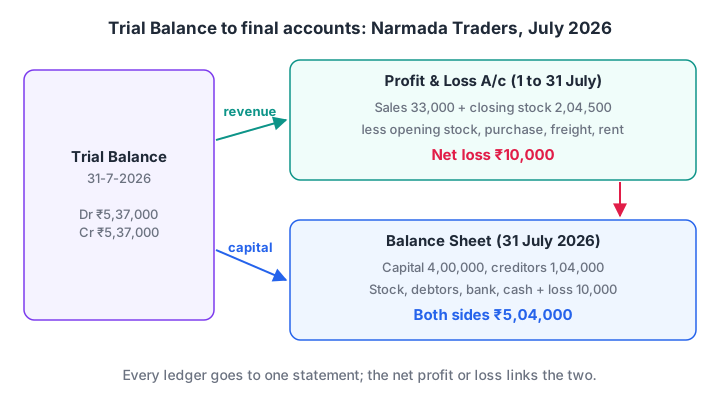
Every Trial Balance line goes to exactly one statement. Net profit or loss is the bridge between them.
How to read the Balance Sheet in TallyPrime
The Balance Sheet shows what the business owns (assets) and owes (liabilities and capital) on one date. Both sides always total the same.
- Gateway of Tally > Balance Sheet, or Alt+G.
- Press F2 and set the date to 31-7-2026.
- Press Alt+F5 to expand groups into ledgers, and Ctrl+H to switch to the vertical view.
- F8 (Valuation) or Ctrl+B changes the stock valuation method used for closing stock.
| Liabilities | ₹ | Assets | ₹ |
|---|---|---|---|
| Capital Account | 4,00,000 | Current Assets: Closing Stock | 2,04,500 |
| Current Liabilities: Sundry Creditors | 1,04,000 | Current Assets: Sundry Debtors | 27,200 |
| Current Assets: Bank | 2,51,500 | ||
| Current Assets: Cash | 10,800 | ||
| Profit & Loss A/c (loss) | 10,000 | ||
| Total | 5,04,000 | Total | 5,04,000 |
By default, TallyPrime shows a loss on the assets side. If you prefer it deducted from capital, F12 has an option to show the loss under liabilities in the horizontal view.
Quick check
Where does TallyPrime show a net loss in the horizontal Balance Sheet by default?
By default the Profit & Loss A/c debit balance (a loss) appears on the assets side. An F12 option can show it under liabilities instead.
Export, print and share reports
Any report can leave TallyPrime in three ways: Alt+E exports it (to Excel, PDF and other formats), Alt+P prints it, and Alt+M shares it by e-mail or WhatsApp.
Owners who want to see figures on a phone can also turn on Enable Browser Access for Reports in F11 > Online Access, which lets authorised users view reports in a browser.
Many accountants export the Profit & Loss A/c and Sales Register to Excel and analyse them further. The Excel pivot tables tutorial shows how to slice sales by month and party. Reports become far more useful when GST data is added; that is covered in GST returns.
Common mistakes when reading reports
Wrong period. Most "missing" entries are just outside the period. Check the dates at the top and press F2.
Trusting a balanced Trial Balance. Balance only proves equal debits and credits. Review ledgers for wrong parties and duplicates.
Ignoring stock valuation. Closing stock drives gross profit. A wrong stock rate makes the P&L wrong even when every voucher is right.
Reading condensed views only. Group totals can hide an expense posted to the wrong ledger. Use Alt+F5 when something looks odd.
Key takeaways
- All TallyPrime reports are calculated from vouchers; correct vouchers mean correct reports.
- The Day Book checks daily entry, Ledger Vouchers show one account, and the Trial Balance checks that debits equal credits.
- The Profit & Loss A/c gives gross and net profit for a period; the Balance Sheet gives the position on a date.
- F2, Alt+F5, F12, Ctrl+B and Alt+N work across reports, and Alt+E exports to Excel.
- Learn the keys that make this quick in TallyPrime shortcut keys, then start the GST section with GST basics.
FAQ
How do I open the Trial Balance in TallyPrime?
Go to Gateway of Tally > Display More Reports > Trial Balance, or press Alt+G, type "Trial Balance" and press Enter. It opens as on the last voucher date in group-wise form. Press F5 for a ledger-wise list and F2 to change the date.
What is the difference between the Trial Balance and the Balance Sheet?
The Trial Balance lists every ledger's balance, including incomes and expenses, to check that debits equal credits. The Balance Sheet is a final statement that shows only assets, liabilities and capital on a date, with the period's net profit or loss carried in as one figure.
Why is closing stock shown in the Profit & Loss A/c?
Closing stock is the cost of goods you bought but haven't sold yet. Adding it to the credit side removes that unsold cost from the period's expenses, so gross profit reflects only the goods actually sold. The same value then appears as a current asset in the Balance Sheet.
Can I export TallyPrime reports to Excel?
Yes. Open the report, press Alt+E (Export), choose the Excel format, and set the file location. Exporting is useful for comparing months, building charts or combining Tally data with other sources. Analysts often build a pivot table from an exported Sales Register.
What should I learn after Tally reports to move into analytics?
Learn Excel well first, then SQL and a BI tool such as Power BI, so you can analyse the data Tally produces. Debugshala, which also teaches TallyPrime at Old Palasia (ask about TallyPrime classes at Old Palasia), offers a data analytics course in Indore with a free demo class. For logic practice, use the reasoning tests on Debugshala Test.
From the team behind this site
Go further with the Data Analytics Course at Debugshala
These tutorials are written by Debugshala, a training and placement institute at Old Palasia, Indore. The classroom course adds live mentoring, real projects and interview preparation.
- Offline classes at Old Palasia, Indore
- Free demo class before you pay
- Non-IT, fresher and year-gap friendly
- Placement assistance
700+ students placed · 200+ hiring partners · 4.9★ Google rating
