

Dashboard Design in Power BI: KPI Layout, Charts and Slicers
Design KPI dashboards that people use: choosing KPIs, layout, chart choice and colour, plus Power BI data models, measures and slicers explained simply.
Think about the scoreboard during an India match at a packed screening in Indore. In one glance you see the score, overs bowled, current run rate and the required run rate. You do not see the ball-by-ball log, even though it exists.
If you want detail, you open the scorecard: each batter, each bowler, each partnership. The scoreboard tells you whether to worry. The scorecard tells you why.
A business dashboard works the same way. The score and run rate are your KPIs (key performance indicators). "Required rate vs current rate" is the comparison that gives a number meaning. The scorecard you open on demand is the drill-down or detail view. Choosing to see only the last 5 overs is a filter, which Power BI calls a slicer.
A KPI dashboard is a single screen that shows the few numbers that matter most for a decision, each compared with a target or past period, with filters and detail available on demand.
Step 1: start from the decision and choose the KPIs
Before you open Power BI, write down who will use the dashboard and what they will decide with it. A store manager deciding on staff and stock needs different numbers from a finance head checking margins.
A useful KPI passes three tests:
- It connects to a decision. If the number moves, someone knows what to do.
- It has a comparison. "Revenue ₹48 lakh" means little. "Revenue ₹48 lakh, up 6% on last month and 2% below target" is useful.
- It has a clear definition. Does "orders" include cancelled ones? Write the rule down once and use it everywhere.
Keep the headline row to 3 to 5 KPIs. More than that, and nothing stands out. Here is how you might compute four common retail KPIs and their month-on-month change, the same numbers you would later show as cards.
import numpy as np
import pandas as pd

rng = np.random.default_rng(7)
n = 400
orders = pd.DataFrame({
    "month": rng.choice(["Feb", "Mar"], size=n, p=[0.48, 0.52]),
    "amount": rng.integers(300, 2500, size=n),
    "returned": rng.random(n) < 0.04,
})

def kpis(df):
    return {
        "Revenue": df["amount"].sum(),
        "Orders": len(df),
        "Avg order value": round(df["amount"].mean()),
        "Return rate %": round(df["returned"].mean() * 100, 1),
    }

prev, curr = kpis(orders[orders["month"] == "Feb"]), kpis(orders[orders["month"] == "Mar"])
for name in curr:
    change = (curr[name] - prev[name]) / prev[name] * 100
    print(f"{name:16} {curr[name]:>10,}   vs last month {change:+.1f}%")
Notice that return rate is a KPI where up is bad. Your dashboard must show that clearly, which is a job for colour, covered below.
Step 2: lay out the page from summary to detail
People read a screen roughly from the top-left corner, across and then down. Put the most important information where the eye lands first.
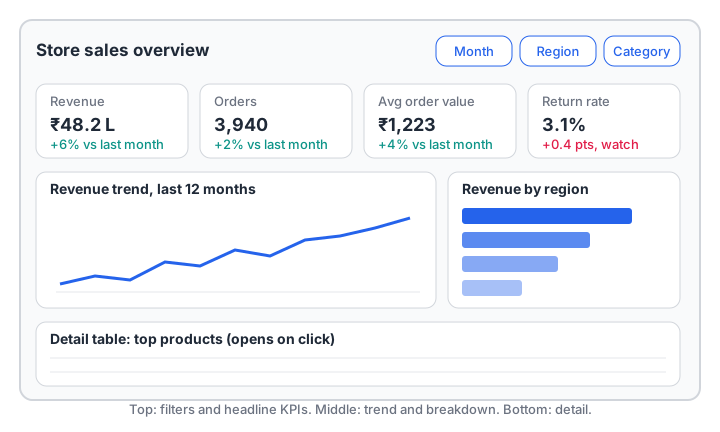
A three-layer layout: headline KPIs and filters at the top, trend and breakdown in the middle, detail at the bottom.
The wireframe follows three layers:
- Glance. A row of KPI cards, each with a comparison. Slicers sit in the same top band so viewers set the context before reading.
- Explore. A trend chart (how the main KPI moves over time) next to a breakdown chart (which region, product or channel drives it).
- Detail. A table of top items for people who need to act on specific rows.
Sketch this on paper first. Moving a box on paper takes seconds; rebuilding a page in Power BI takes much longer.
Step 3: choose the chart by the question
Each chart type answers a particular kind of question. Start from the question, not from the chart you like.
| Question | Best chart | Avoid |
|---|---|---|
| How is it changing over time? | Line chart | Pie, many bars |
| Which category is largest? | Sorted bar chart | 3D bars |
| What share of the whole? (2–4 parts) | Stacked bar or donut | Pie with 8 slices |
| Are we on target? | KPI card or bullet chart | Speedometer gauges for everything |
| How do two numbers relate? | Scatter plot | Two separate charts |
| What are the exact values? | Table or matrix | A chart with tiny labels |
Sort bar charts from largest to smallest unless the categories have a natural order, such as months. Start bar axes at zero; a bar that starts at 90 makes a 2% difference look like 50%.
Quick check
Which chart best shows how monthly revenue changed over the last 12 months?
Line charts show change over time most clearly, making trends and dips easy to spot at a glance.
Step 4: use colour to highlight, not decorate
Colour is the strongest signal on a page, so spend it carefully.
- Use one neutral base. Most visuals can be one shade of blue or grey.
- Reserve one highlight colour for the thing you want noticed, such as the current month or the weakest region.
- Keep good and bad consistent. Green or teal for improvement, red for a problem, and remember that for return rate or cost, an increase is the problem.
- Keep category colours fixed. If Indore is blue on one chart, it should be blue on every chart.
- Do not rely on colour alone. Around 1 in 12 men have some colour vision deficiency, so add arrows, labels or plus and minus signs as well.
Step 5: add interactivity people will use
Power BI gives you several ways to let viewers explore without building new pages.
- Slicers are on-page filters (month, region, category). Add only the ones your users asked for; five slicers nobody touches is clutter.
- Cross-filtering happens automatically: clicking a region bar filters the other visuals on the page.
- Drill-down lets a viewer go from year to quarter to month inside one chart.
- Tooltips show extra numbers when someone hovers, which keeps the main view clean.
- Drill-through opens a detail page for one selected item, such as a single store.
Power BI concepts: data model, measures and slicers
You can design a beautiful page and still get wrong numbers if the model underneath is messy. Three concepts matter most.
The data model and star schema
Power BI works best with a star schema: one central fact table of events (each sale) linked to dimension tables that describe them (date, product, store, customer).
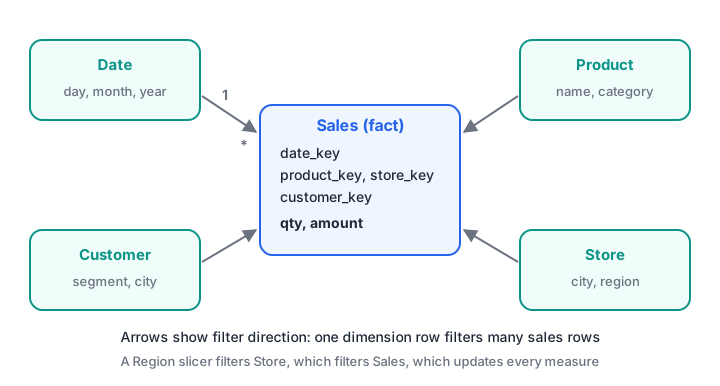
Each dimension row relates to many fact rows, and filters flow from the dimension to the fact table.
When a viewer picks "Region = West" in a slicer, Power BI filters the Store table, the relationship passes that filter to the Sales table, and every visual recalculates. If the relationships are missing or wrong, slicers silently stop working on some visuals.
Measures vs calculated columns
A calculated column is computed once per row and stored, like adding a new column in Excel. A measure is a formula that is calculated on the fly for whatever filters are currently applied. Totals, averages and ratios should almost always be measures. In Power BI, measures are written in DAX, for example:
Total Revenue = SUM ( Sales[amount] )
Avg Order Value = DIVIDE ( [Total Revenue], COUNTROWS ( Sales ) )
The Python below imitates that behaviour: one measure function, evaluated under different slicer selections, gives a different answer each time without being rewritten.
import pandas as pd

sales = pd.DataFrame({
    "region": ["West", "West", "Central", "Central", "East", "West", "East"],
    "category": ["Snacks", "Dairy", "Snacks", "Grocery", "Dairy", "Grocery", "Snacks"],
    "amount": [1200, 800, 950, 2200, 600, 1800, 700],
})

def avg_order_value(df):          # like a DAX measure
    return round(df["amount"].sum() / len(df)) if len(df) else 0

def apply_slicers(df, **chosen):  # like slicers on the page
    for col, values in chosen.items():
        df = df[df[col].isin(values)]
    return df

print("No slicer:      ", avg_order_value(sales))
print("Region = West:  ", avg_order_value(apply_slicers(sales, region=["West"])))
print("Snacks, W + E:  ", avg_order_value(apply_slicers(
    sales, region=["West", "East"], category=["Snacks"])))
That is the core idea behind Power BI's filter context: write the measure once, and the slicers decide which rows it sees.
Turning KPIs into status labels
KPI cards often show a status against a target. The logic is simple enough to test in Python before you build it in Power BI, including the trick that some KPIs are better when lower.
kpis = [
    # name, actual, target, higher_is_better
    ("Revenue (lakh)", 48.2, 50.0, True),
    ("Orders", 3940, 3800, True),
    ("Return rate %", 3.1, 2.5, False),
]

for name, actual, target, higher_is_better in kpis:
    gap_pct = (actual - target) / target * 100
    good = gap_pct >= 0 if higher_is_better else gap_pct <= 0
    if good:
        status = "on track"
    elif abs(gap_pct) <= 5:
        status = "watch"
    else:
        status = "act now"
    print(f"{name:15} actual {actual:>7} target {target:>7} gap {gap_pct:+6.1f}%  -> {status}")
Revenue is 3.6% short, so it gets "watch". Return rate is 24% above its target, and because lower is better here, it gets "act now".
Quick check
A viewer selects "Region = West" in a slicer and the Avg Order Value card changes. What makes this possible?
Measures are evaluated in the current filter context, so the same formula returns a new value whenever slicers change.
Common dashboard design mistakes
- Too many KPIs. Twelve cards in the top row means none of them is important.
- Numbers without context. Every headline number needs a comparison: last period, target or both.
- Pie charts with many slices. People cannot compare angles well. Use a sorted bar chart.
- Flat, single-table models. One huge exported table makes measures slow and slicers unreliable. Build a star schema.
- Designing for yourself. Test the page with a real user. If they cannot answer their main question in 10 seconds, simplify.
If your source numbers come from a database, the SQL patterns in SQL for data analysis are what you will use to prepare the fact table, and pandas groupby and pivot tables helps you cross-check the totals your dashboard shows.
Key takeaways
- Begin with the user and the decision, then choose 3 to 5 KPIs with comparisons.
- Lay out the page in three layers: glance, explore, detail.
- Pick each chart by the question it answers, and use colour mainly to highlight.
- Add only the slicers and drill-downs people will actually use.
- In Power BI, a star-schema model plus measures keeps numbers correct when filters change.
FAQ
How many KPIs should a dashboard have?
Three to five headline KPIs is a good rule for one page. If a team genuinely needs more, split them across pages by audience or topic instead of crowding one screen. Supporting numbers can live in tooltips and detail tables.
Do I need to learn DAX to use Power BI?
You can build simple reports without it, using automatic sums. For real KPI dashboards, you will need basic DAX measures such as SUM, DIVIDE, CALCULATE and time comparisons like previous month. Start with a handful of measures and add more as questions demand.
Is Power BI better than Tableau for beginners?
Both are widely used, and the design principles in this article apply to both. Power BI is common in companies that already use Microsoft tools and Excel, which makes it a practical first choice for many learners. Once you understand data models and chart choice, switching tools is not difficult.
Where can I learn Power BI with practice in Indore?
Debugshala teaches Power BI and dashboard design in offline classes at its Old Palasia campus, with teaching in English and Hindi. You can explore the BI tools course at Debugshala, which welcomes non-IT learners and offers a free demo class before you pay. For quick revision, attempt aptitude and reasoning quizzes on Debugshala Test.
From the team behind this site
Go further with the Data Analytics Course at Debugshala
These tutorials are written by Debugshala, a training and placement institute at Old Palasia, Indore. The classroom course adds live mentoring, real projects and interview preparation.
- Offline classes at Old Palasia, Indore
- Free demo class before you pay
- Non-IT, fresher and year-gap friendly
- Placement assistance
700+ students placed · 200+ hiring partners · 4.9★ Google rating
