

Data Cleaning with Pandas: A Step-by-Step Guide for Beginners
Clean messy data in pandas step by step: duplicates, wrong types, inconsistent text, missing values and outliers, with runnable code on a real-looking sheet.
Imagine a coaching centre in Bhanwarkuan that collects admission details through a Google Form. Three counsellors also type walk-in students into the same sheet. At the end of the month the owner asks a simple question: "How much fee did we collect from Indore students?"
You open the sheet and find "Indore", "indore", "INDORE" and " Indore" as four different cities. One fee is written "5,000" with a comma, one says "abc", and one is blank. The same student appears twice because two counsellors both entered him. Someone's age is 210.
If you add up the fee column now, you will get the wrong answer, or an error.
The sheet is your raw dataset. Each spelling of Indore is an inconsistent category. "5,000" stored as text is a wrong data type. The blank fee is a missing value, the double entry is a duplicate, and the age of 210 is an outlier. Cleaning is the work of turning that sheet into one you can trust.
Data cleaning is the process of finding and fixing errors, inconsistencies and gaps in a dataset so that every later calculation gives a correct result.
The data cleaning checklist
As the daily workflow of a data analyst shows, cleaning often takes most of an analyst's time. It goes faster when you follow the same order every time instead of fixing things randomly.
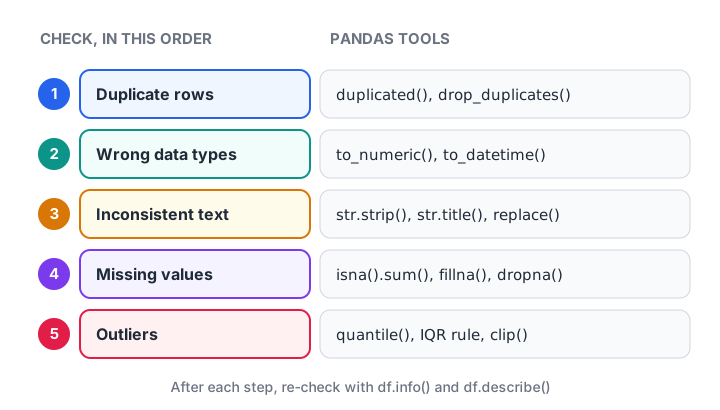
Five checks, in order, with the pandas methods that handle each one.
Why this order? Removing exact duplicates first means you do less work later. Fixing types comes before missing values, because converting "abc" to a number reveals new gaps you would otherwise miss.
Text cleanup reveals hidden duplicates ("rahul sharma " and "Rahul Sharma"), so you check duplicates once more after it. Outliers come last because you can only judge them once the numbers are real numbers.
If you are new to pandas itself, read the official pandas getting started guide first, or brush up on type conversion in Python, which is the same idea at a smaller scale.
Step 0: look at the mess before touching it
Here is the messy admissions sheet. Every code block below rebuilds it, so each block runs on its own.
import pandas as pd

raw = pd.DataFrame({
    "name": ["Rahul Sharma", "rahul sharma ", "Priya Verma", "Priya Verma",
             "Aman Gupta", "Neha Jain", "Karan Patel", "Sana Khan"],
    "city": ["Indore", "indore", "INDORE", "INDORE", "Bhopal", " Ujjain", None, "Indore"],
    "fee": ["4500", "4500", "5,000", "5,000", None, "3800", "4200", "abc"],
    "joined": ["2026-01-05", "2026-01-05", "2026-01-06", "2026-01-06",
               "2026-01-07", "2026-01-08", "not given", "2026-01-09"],
    "age": [22, 22, 23, 23, 24, 210, 21, 25],
})

print(raw)
print("\nColumn types:")
print(raw.dtypes)
print("\nMissing per column:")
print(raw.isna().sum())
Notice that fee and joined are text columns, not numbers or dates. Pandas cannot add "5,000" to "4500". The missing count also looks low, because "abc" and "not given" do not count as missing yet.
Step 1: remove duplicate rows
duplicated() marks rows that are exact copies of an earlier row. drop_duplicates() removes them.
import pandas as pd

raw = pd.DataFrame({
    "name": ["Rahul Sharma", "rahul sharma ", "Priya Verma", "Priya Verma", "Aman Gupta"],
    "city": ["Indore", "indore", "INDORE", "INDORE", "Bhopal"],
    "fee": ["4500", "4500", "5,000", "5,000", None],
})

print("Exact duplicates found:", raw.duplicated().sum())
print(raw[raw.duplicated(keep=False)])

df = raw.drop_duplicates().reset_index(drop=True)
print("\nRows before:", len(raw), "after:", len(df))
print(df)
Priya's second row is removed. Rahul's two rows survive because one has lowercase letters and a trailing space, so pandas sees them as different. We will catch him after the text step.
You can also check duplicates on chosen columns only, such as subset=["name", "joined"], when a student should appear once per joining date.
Step 2: fix wrong data types
Numbers stored as text are the most common type problem. Remove the formatting first, then convert. errors="coerce" turns anything that still cannot be converted into a missing value instead of crashing.
import pandas as pd

df = pd.DataFrame({
    "fee": ["4500", "5,000", None, "3800", "4200", "abc"],
    "joined": ["2026-01-05", "2026-01-06", "2026-01-07",
               "2026-01-08", "not given", "2026-01-09"],
})

df["fee"] = pd.to_numeric(df["fee"].str.replace(",", "", regex=False),
                          errors="coerce")
df["joined"] = pd.to_datetime(df["joined"], format="%Y-%m-%d", errors="coerce")

print(df)
print("\nTypes now:")
print(df.dtypes)
print("\nTotal fee:", df["fee"].sum())
The fee column is now numeric and can be summed. "abc" became NaN and "not given" became NaT (missing date). That is honest: those values were never real numbers or dates.
Quick check
What does pd.to_numeric(s, errors="coerce") do with the value "abc"?
errors="coerce" replaces anything that cannot be parsed with NaN, so you can count and handle it as a missing value.
Step 3: standardise inconsistent text
Text problems hide in capital letters, extra spaces and spelling variants. Chain str.strip() and str.title() to fix most of them, then use replace() for known variants.
import pandas as pd

df = pd.DataFrame({
    "name": ["Rahul Sharma", "rahul sharma ", "Priya Verma", "Neha Jain"],
    "city": ["Indore", "indore", " INDORE", "Ujjain city"],
    "fee": [4500, 4500, 5000, 3800],
})

print("Cities before:", df["city"].unique().tolist())

for col in ["name", "city"]:
    df[col] = df[col].str.strip().str.title()
df["city"] = df["city"].replace({"Ujjain City": "Ujjain"})

print("Cities after: ", df["city"].unique().tolist())
print("Hidden duplicates now visible:", df.duplicated().sum())

df = df.drop_duplicates().reset_index(drop=True)
print(df)
After cleaning, Rahul's two rows become identical and the second check removes one. This is why the checklist says to look at duplicates again after the text step.
Quick check
Why should you check for duplicates again after cleaning text?
"rahul sharma " and "Rahul Sharma" are different strings until you strip and title-case them. After that, they are exact duplicates.
Step 4: handle missing values
First count, then decide per column. There is no single right answer. The question is: what would a careful human do with this blank?
| Column | Sensible choice | Why |
|---|---|---|
| city | Fill with "Unknown" | You still want to count the student |
| fee | Fill with the median, or leave blank and report it | Inventing money can mislead the owner |
| joined | Leave as missing and flag it | A fake date is worse than no date |
import pandas as pd
import numpy as np

df = pd.DataFrame({
    "name": ["Rahul", "Priya", "Aman", "Neha", "Karan", "Sana"],
    "city": ["Indore", "Indore", "Bhopal", "Ujjain", None, "Indore"],
    "fee": [4500, 5000, np.nan, 3800, 4200, np.nan],
})

print("Missing before:")
print(df.isna().sum())

df["city"] = df["city"].fillna("Unknown")
df["fee_missing"] = df["fee"].isna()
df["fee"] = df["fee"].fillna(df["fee"].median())

print("\nMissing after:")
print(df.isna().sum())
print(df)
The fee_missing column keeps a record of which values were filled in. When you report total fees, you can say "2 of 6 values were estimated", which is far more honest than a silent fill. Use dropna() only when a row is useless without that value.
Step 5: detect and treat outliers
An outlier is a value far away from the rest. The IQR rule is a simple, widely used test: anything below Q1 − 1.5 × IQR or above Q3 + 1.5 × IQR is flagged.
import pandas as pd

ages = pd.Series([22, 23, 24, 210, 21, 25, 23, 22], name="age")

q1, q3 = ages.quantile(0.25), ages.quantile(0.75)
iqr = q3 - q1
low, high = q1 - 1.5 * iqr, q3 + 1.5 * iqr
print(f"Q1={q1}, Q3={q3}, allowed range {low:.1f} to {high:.1f}")
print("Flagged:", ages[(ages < low) | (ages > high)].tolist())

# An impossible age is a typo: mark it missing instead of guessing
fixed = ages.mask(ages > 100)
print("Masked:", fixed.tolist())

# For real but extreme values (e.g. big orders), clipping is an option
print("Clipped:", ages.clip(lower=low, upper=high).round(1).tolist())
Choose the treatment by asking whether the value is impossible or just unusual. Age 210 is impossible, so masking it is right. A 50,000 rupee order at a sweet shop during Diwali might be unusual but real, and deleting it would hide your best customer.
Common mistakes in data cleaning
- Cleaning without counting. Always print the number of duplicates, conversions and fills. Numbers make your cleaning reviewable.
- Filling everything with zero. A missing fee is not a zero fee. Zero drags averages down and hides the gap.
- Deleting outliers automatically. The IQR rule only flags values. You decide.
- Overwriting the raw data. Keep
rawuntouched and work on a copy, so you can always start again. - Chained assignment. Writing
df[df["city"] == "Indore"]["fee"] = 0does not changedf. Usedf.loc[df["city"] == "Indore", "fee"] = 0.
Once your data is clean, the real analysis starts. The next step is usually summarising it, which you will learn in pandas groupby and pivot tables.
Key takeaways
- Follow one order: duplicates, types, text, missing values, outliers, then re-check duplicates.
- Use
to_numericandto_datetimewitherrors="coerce"to convert safely. str.strip().str.title()fixes most text inconsistencies in one line.- Decide missing-value treatment per column and keep a flag of what you filled.
- Flag outliers with the IQR rule, then mask impossible values and keep real extremes.
FAQ
What is the difference between dropna() and fillna() in pandas?
dropna() removes rows (or columns) that contain missing values, while fillna() replaces missing values with something you choose, such as a median or a label. Drop when the row is useless without that value. Fill when the rest of the row still matters and you have a sensible replacement.
How much time does data cleaning take in real analytics jobs?
It varies with the source, but cleaning and preparing data is commonly described as the biggest part of an analyst's work. Data typed by people, merged from several systems or exported from old software needs the most work. Writing reusable cleaning steps in pandas saves that time on every future report.
Should I clean data in Excel or in pandas?
Excel is fine for a few hundred rows that you clean once. Pandas is better when the file is large, when the same messy file arrives every week, or when you need a record of exactly what you changed. Many analysts check a sample in Excel and do the actual cleaning in pandas.
Where can I practise data cleaning with guidance in Indore?
Debugshala teaches pandas and data cleaning in offline classes at its Old Palasia campus, in English and Hindi. The hands-on data analytics programme at Debugshala is open to fresh graduates and non-IT learners, and you can attend a free demo class first. For self-practice, try the coding quizzes on Debugshala Test.
From the team behind this site
Go further with the Data Analytics Course at Debugshala
These tutorials are written by Debugshala, a training and placement institute at Old Palasia, Indore. The classroom course adds live mentoring, real projects and interview preparation.
- Offline classes at Old Palasia, Indore
- Free demo class before you pay
- Non-IT, fresher and year-gap friendly
- Placement assistance
700+ students placed · 200+ hiring partners · 4.9★ Google rating
