

What is R Programming? Uses, Features and First Code
What R programming is, who uses it and why analysts love it: vectors, data frames, CRAN packages and your first R code on a real Indore retail dataset.
Imagine you are the new analyst at Malwa Mart, a small grocery chain with stores in Vijay Nagar, Palasia, Rajwada and Bhawarkuan. Every evening the managers send you the day's bills, and the owner asks the same questions: which store sold most, what is the average bill, and is Sunday really better than Monday?
You could use a calculator, or drag Excel formulas down each column. Or you could write five short lines once and rerun them every evening on the new bills.
That third option is what R gives you. The bills become a data frame, each column of numbers becomes a vector, and the questions become one-line commands such as mean() and summary(). Because the commands are saved in a script, tomorrow's report is the same script run on tomorrow's data.
R is a free, open-source programming language and environment for statistical computing, data analysis and graphics.
This article opens the R Tutorial series. Every lesson uses the same Malwa Mart data, so by the end of the R Basics section you will have built a small, real analysis project. The series targets R 4.4 or newer.
What is R programming used for?
R is used wherever someone needs to turn a table of numbers into an answer they can defend. That covers far more than academic statistics.
- Business reporting. Weekly sales summaries, store comparisons and customer counts, often turned into automatic PDF or HTML reports.
- Statistics and testing. Did the new shelf layout really raise sales, or was it luck? R has t-tests, chi-square tests and regression built in.
- Data visualisation. The ggplot2 package draws publication-quality charts from a few lines of code.
- Pharma, banking and research. Clinical-trial reports, credit scoring and most published academic analyses.
For a beginner analyst the first three matter most, and R handles all of them in one place.
Where did R come from?
R was created by Ross Ihaka and Robert Gentleman at the University of Auckland in the early 1990s. It was modelled on S, a statistics language developed at Bell Labs, which is why old R code and S code look so similar.
Version 1.0.0 came out in February 2000. Today a volunteer core team maintains R under the GNU GPL licence, so you can install it on any laptop and use it at work without paying a fee.
How does R work? The language, packages and IDE
When people say "I use R", they usually mean three layers working together.
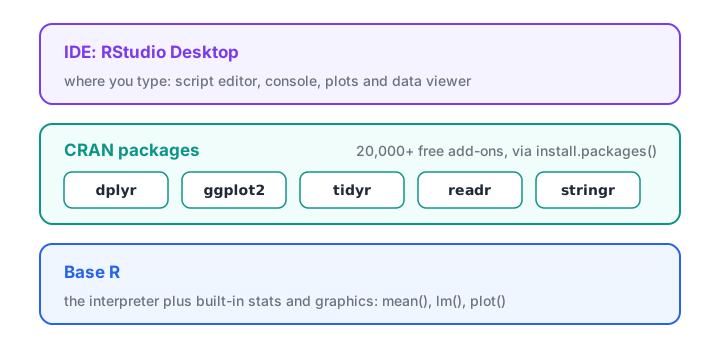
Base R does the computing, packages add specialised tools, and an IDE such as RStudio gives you a comfortable place to type.
- Base R is the language itself plus the built-in packages, such as
statsandgraphics. It already containsmean(),lm()for regression, andplot()for charts. - CRAN packages extend it. CRAN, the Comprehensive R Archive Network, hosts more than 20,000 free packages that you add with
install.packages(). - An IDE (integrated development environment) is the window you work in. RStudio is the most common choice and shows your script, console, data and plots side by side.
The tidyverse is a popular bundle of packages, including dplyr for data manipulation and ggplot2 for charts, that share one consistent style. This series uses base R first, so you understand what the tidyverse is built on, and then moves to dplyr and ggplot2 in the R for Data Analysis section.
Quick check
What is R primarily designed for?
R was created as a language for statistics and data analysis, and it includes strong charting tools.
Key features of the R language
A few features make R feel different from Excel and from general-purpose languages.
Vectorised by default. Most operations work on a whole column at once. prices * 1.05 raises every price by 5 percent without a loop.
Interactive. You type a line in the console and see the answer immediately, which suits exploring new data.
Built for missing data. R has a special value, NA, for "not available". Functions such as mean() let you decide whether to skip missing values or stop and warn you.
Data frames are a core type. A table with named columns of different types is built into the language, not added later by a library.
Reproducible. A script records every step, so anyone with the script and data gets the same numbers.
Your first R code
You can read along without R installed. The next article, Install R and RStudio, walks you through it on Windows, macOS and Linux. Each code block below is followed by the output R prints.
R as a calculator
Type arithmetic in the console and press Enter. The [1] at the start of each answer is R telling you this is the first element of the result.
# Three bills from the Vijay Nagar store, in rupees
520 + 180 + 330
(520 + 180 + 330) / 3
sqrt(144)
10 %% 3[1] 1030
[1] 343.3333
[1] 12
[1] 1A vector of sales
Real analysis starts when you store numbers under a name. In R you assign with <-, read aloud as "gets". The function c() combines values into a vector.
daily_sales <- c(18450, 16200, 17900, 15800, 21300, 26750, 24100)

mean(daily_sales)
max(daily_sales)
summary(daily_sales)[1] 20071.43
[1] 26750
Min. 1st Qu. Median Mean 3rd Qu. Max.
15800 17050 18450 20071 22700 26750 summary() gives the minimum, quartiles, median, mean and maximum in one call, often the first thing an analyst runs on a new column.
A small table of orders
A data frame holds a table. Here six orders from four stores are summarised by store with tapply(), which applies a function to groups.
orders <- data.frame(
  store  = c("Vijay Nagar", "Palasia", "Rajwada",
             "Vijay Nagar", "Bhawarkuan", "Palasia"),
  amount = c(520, 180, 330, 360, 340, 240)
)

orders
tapply(orders$amount, orders$store, sum) store amount
1 Vijay Nagar 520
2 Palasia 180
3 Rajwada 330
4 Vijay Nagar 360
5 Bhawarkuan 340
6 Palasia 240
Bhawarkuan Palasia Rajwada Vijay Nagar
340 420 330 880 The $ sign picks one column out of a data frame.
If you already know Python, here is the same store total in pandas. You can run it right here in the browser.
import pandas as pd

orders = pd.DataFrame({
    "store": ["Vijay Nagar", "Palasia", "Rajwada",
              "Vijay Nagar", "Bhawarkuan", "Palasia"],
    "amount": [520, 180, 330, 360, 340, 240],
})
print(orders.groupby("store")["amount"].sum())
print("Mean bill:", orders["amount"].mean())
Who should learn R, and is it still worth it?
R is worth learning if you want to work with data, especially in analytics, research or any statistics-heavy role. Many analyst job descriptions list "SQL plus Python or R".
The table below compares R with the tools a new analyst usually weighs it against.
| Tool | Best at | Weak spot |
|---|---|---|
| Excel | Quick looks, small sheets, sharing with managers | Repeating the same steps, large files |
| R | Statistics, charts, reproducible reports | Building web apps and general software |
| Python | General programming, automation, machine learning | More setup before statistical tests feel natural |
| SQL | Pulling and joining data inside databases | Charts and statistics |
Most analysts end up using two or three of these together. For a deeper comparison, read R vs Python for data analysis. To see how R fits into the daily routine of the job, the guide on what a data analyst does is a good companion.
The R analysis workflow
Whatever the project, R work tends to follow the same loop.
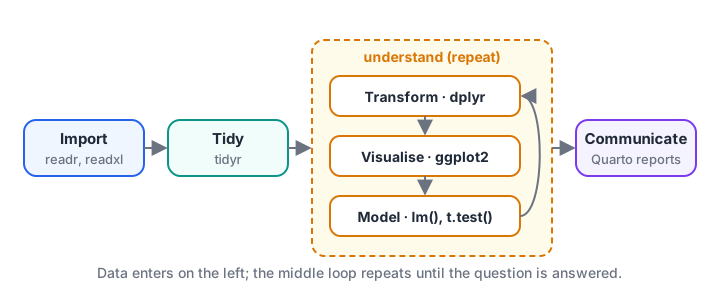
The typical loop of an R analysis. Transforming, charting and modelling repeat until the question is answered.
If you want this loop taught with live projects and feedback, the R and analytics classroom training at Debugshala covers it in Indore.
Common mistakes beginners make with R
Expecting indexes to start at 0. R counts from 1. The first element of
daily_salesisdaily_sales[1].Forgetting R is case-sensitive.
Mean(x)fails because the function ismean(x).Salesandsalesare two different variables.Mixing up
=and<-. Both assign at the top level, but the R community style uses<-for assignment and=for function arguments.Treating RStudio as R. RStudio is only the editor. You must install R first, or RStudio has nothing to run.
Typing code only in the console. Use a script file so you can rerun it.
Ignoring warnings. A message such as "NAs introduced by coercion" means some values became missing. Read it before you trust the result.
Quick check
In R, what does daily_sales[1] return?
R uses 1-based indexing, so position 1 is the first element.
Key takeaways
- R is a free, open-source language for statistics, data analysis and charts.
- It works in three layers: base R, CRAN packages and an IDE such as RStudio.
- Operations are vectorised, so one line can process an entire column.
- Data frames, missing values (
NA) and statistical functions are built in. - A saved R script makes your analysis repeatable on tomorrow's data.
- Next, set up your tools with Install R and RStudio.
FAQ
Is R programming hard to learn for beginners?
R is manageable for beginners, especially those comfortable with Excel. The first week feels unusual because of <- and 1-based indexing, but simple analyses take only a few lines. Most learners can summarise and chart a real dataset within two or three weeks of regular practice.
Is R a programming language or software?
R is both a programming language and the software environment that runs it. You write R code, and the R interpreter executes it. Tools such as RStudio are separate editors that sit on top of R and make it easier to use, but they cannot run code without R installed.
Is R free to use?
Yes. R is free and open-source software released under the GNU General Public License. You can download it from CRAN, use it commercially and install as many packages as you like without paying. RStudio Desktop, the most common editor for R, also has a free open-source edition.
Should a data analyst learn R or Python first?
Learn whichever your target jobs ask for, then add the other. Python is more common in general analytics and tech companies, while R is strong in research, pharma and statistics-heavy teams. The core ideas, such as data frames, grouping and charts, transfer directly between the two languages.
Can I learn R programming in Indore with classroom support?
Yes. Debugshala teaches data analytics in English and Hindi at its Old Palasia campus in Indore, and offers a free demo class before you pay. Its batches accept fresh graduates and non-IT learners. Between classes you can test yourself on Debugshala's practice platform.
From the team behind this site
Go further with the Data Analytics Course at Debugshala
These tutorials are written by Debugshala, a training and placement institute at Old Palasia, Indore. The classroom course adds live mentoring, real projects and interview preparation.
- Offline classes at Old Palasia, Indore
- Free demo class before you pay
- Non-IT, fresher and year-gap friendly
- Placement assistance
700+ students placed · 200+ hiring partners · 4.9★ Google rating
