

R Matrices and Arrays: matrix(), Indexing, apply() and More
Learn R matrices and arrays with store-by-category sales: build with matrix(), name rows and columns, index with [i, j], add totals and stack months.
On the wall of Malwa Mart's head office hangs a sheet that the owner checks every month. Down the left side are the four stores: Vijay Nagar, Palasia, Rajwada and Bhawarkuan. Across the top are three categories: Grocery, Dairy and Snacks. Each cell holds that store's sales in that category, in thousands of rupees.
With one glance the owner can read across a row to see how a store did, or down a column to compare stores on dairy. When November ends, the clerk pins a new sheet of the same shape on top of October's. A stack of identical grids, one per month.
In R that single sheet is a matrix. The stores are rows, the categories are columns, and each cell is an element found by its row and column number. The stack of monthly sheets is an array with three dimensions: store, category and month.
A matrix in R is a two-dimensional data structure that holds values of a single type in rows and columns; an array extends the same idea to three or more dimensions.
A matrix is really a vector with a dim attribute that tells R how to fold it into rows and columns. That is why the one-type rule still applies. Code here targets R 4.4+.
How do you create a matrix in R?
Pass a vector to matrix() and say how many rows (or columns) you want. R then pours the values in column by column, top to bottom, which is the single most important thing to remember.
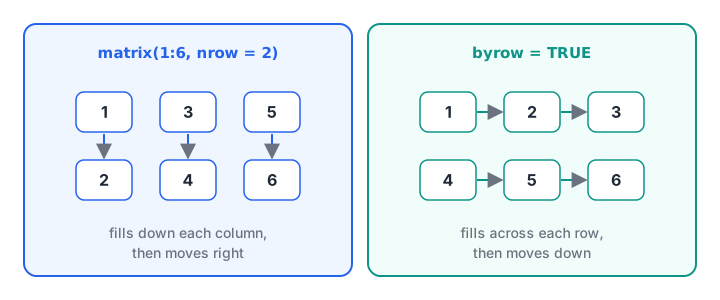
The same six values poured into a 2 by 3 matrix. Default filling goes down the columns; byrow = TRUE goes across the rows.
matrix(1:6, nrow = 2)
matrix(1:6, nrow = 2, byrow = TRUE) [,1] [,2] [,3]
[1,] 1 3 5
[2,] 2 4 6
[,1] [,2] [,3]
[1,] 1 2 3
[2,] 4 5 6Now the real sheet. The values are entered column by column: four grocery figures, then four dairy, then four snacks. dimnames attaches store and category labels.
oct <- matrix(
  c(412, 356, 298, 264,    # Grocery
    168, 141, 102,  97,    # Dairy
     95,  88, 121,  73),   # Snacks
  nrow = 4,
  dimnames = list(c("Vijay Nagar", "Palasia", "Rajwada", "Bhawarkuan"),
                  c("Grocery", "Dairy", "Snacks"))
)

oct
dim(oct)
nrow(oct)
ncol(oct) Grocery Dairy Snacks
Vijay Nagar 412 168 95
Palasia 356 141 88
Rajwada 298 102 121
Bhawarkuan 264 97 73
[1] 4 3
[1] 4
[1] 3You can also set labels later with rownames(oct) <- ... and colnames(oct) <- .... Named matrices are far easier to index and to read in output.
Quick check
What does matrix(1:6, nrow = 2)[1, ] return?
matrix() fills column by column, so row 1 holds 1, 3 and 5.
How do you index a matrix in R?
Matrix indexing uses two positions inside the brackets, [row, column], separated by a comma. Leave one side empty to mean "all of them". Each side accepts numbers, names, negative numbers or a logical vector, exactly as with vectors.
oct[1, 2]
oct["Rajwada", "Snacks"]
oct["Palasia", ]
oct[, "Dairy"]
oct[c("Vijay Nagar", "Bhawarkuan"), c("Grocery", "Snacks")]
oct[oct[, "Grocery"] > 300, ][1] 168
[1] 121
Grocery Dairy Snacks
356 141 88
Vijay Nagar Palasia Rajwada Bhawarkuan
168 141 102 97
Grocery Snacks
Vijay Nagar 412 95
Bhawarkuan 264 73
Grocery Dairy Snacks
Vijay Nagar 412 168 95
Palasia 356 141 88The last line filters rows by a condition: it keeps stores whose grocery sales are above 300 thousand. Notice that taking a single row or column returns a plain named vector, not a one-row matrix. R drops the unused dimension.
Keeping the matrix shape with drop = FALSE
Dropping is usually convenient but can break code that expects a matrix. Add drop = FALSE to keep the result two-dimensional.
oct["Palasia", , drop = FALSE]
dim(oct["Palasia", , drop = FALSE]) Grocery Dairy Snacks
Palasia 356 141 88
[1] 1 3Row and column summaries: rowSums, colSums and apply
Analysts rarely want single cells. They want totals per store and per category. R has fast dedicated functions for sums and means, and apply() for anything else.
rowSums(oct)
colSums(oct)
round(colMeans(oct), 1)
apply(oct, 1, max)
apply(oct, 2, function(col) names(which.max(col)))Vijay Nagar Palasia Rajwada Bhawarkuan
675 585 521 434
Grocery Dairy Snacks
1330 508 377
Grocery Dairy Snacks
332.5 127.0 94.2
Vijay Nagar Palasia Rajwada Bhawarkuan
412 356 298 264
Grocery Dairy Snacks
"Vijay Nagar" "Vijay Nagar" "Rajwada" In apply(), the second argument is the margin: 1 means "for each row", 2 means "for each column". The last line asks, for each category, which store sold the most.
Rajwada leads snacks even though it ranks only third in grocery
, which is a useful insight for stocking decisions. The apply() family has its own lesson, R apply, lapply and sapply.
Adding a totals row or column
cbind() binds columns and rbind() binds rows. Together they turn the sheet into a report with totals.
report <- cbind(oct, Total = rowSums(oct))
report <- rbind(report, All = colSums(report))
report Grocery Dairy Snacks Total
Vijay Nagar 412 168 95 675
Palasia 356 141 88 585
Rajwada 298 102 121 521
Bhawarkuan 264 97 73 434
All 1330 508 377 2215Quick check
In apply(m, 2, sum), what does the 2 mean?
Margin 1 means rows and margin 2 means columns.
Matrix arithmetic and multiplication
Ordinary operators work element by element, just like vectors. oct * 1.1 raises every cell by 10 percent, and oct / 100 converts thousands of rupees into lakhs. True matrix multiplication uses a different operator, %*%.
round(oct / rowSums(oct) * 100)

qty <- matrix(c(2, 1, 0,
                0, 3, 4),
              nrow = 2, byrow = TRUE,
              dimnames = list(c("order_1", "order_2"),
                              c("Toor Dal", "Poha", "Paneer")))
price <- c(165, 60, 90)
qty %*% price
t(qty) Grocery Dairy Snacks
Vijay Nagar 61 25 14
Palasia 61 24 15
Rajwada 57 20 23
Bhawarkuan 61 22 17
[,1]
order_1 390
order_2 540
order_1 order_2
Toor Dal 2 0
Poha 1 3
Paneer 0 4The first line gives each store's category mix as percentages of its own total, using recycling of rowSums() down each column. Vijay Nagar earns 61 percent of its sales from grocery.
qty %*% price multiplies each order's quantities by the matching prices and adds them up: order 1 is 2 × 165 + 1 × 60 = 390 rupees. That is what matrix multiplication does, and it scales to thousands of orders at once. t() transposes, swapping rows and columns.
What is an array in R?
An array is a matrix with more than two dimensions. Malwa Mart's stack of monthly sheets becomes a 4 × 3 × 2 array: 4 stores, 3 categories, 2 months.
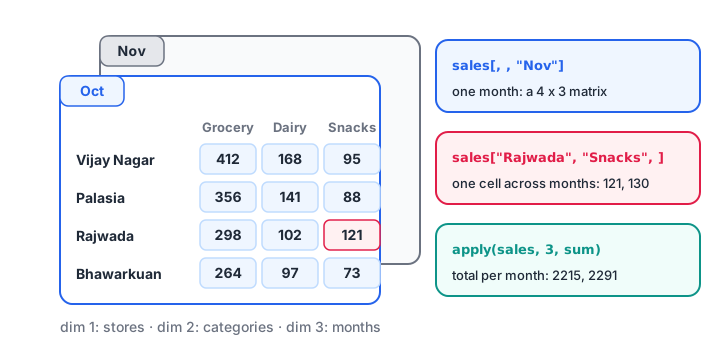
A three-dimensional array is a stack of matrices. The third index chooses the sheet.
nov <- matrix(c(430, 349, 310, 281,
                175, 150,  99, 104,
                102,  91, 130,  70), nrow = 4)

sales <- array(c(oct, nov), dim = c(4, 3, 2),
               dimnames = list(rownames(oct), colnames(oct), c("Oct", "Nov")))

dim(sales)
sales[, , "Nov"]
sales["Rajwada", "Snacks", ]
apply(sales, 3, sum)
apply(sales, c(1, 3), sum)[1] 4 3 2
Grocery Dairy Snacks
Vijay Nagar 430 175 102
Palasia 349 150 91
Rajwada 310 99 130
Bhawarkuan 281 104 70
Oct Nov
121 130
Oct Nov
2215 2291
Oct Nov
Vijay Nagar 675 707
Palasia 585 590
Rajwada 521 539
Bhawarkuan 434 455The pattern [row, column, sheet] extends naturally. apply(sales, 3, sum) totals each month, and apply(sales, c(1, 3), sum) totals each store in each month, giving back a matrix. Total sales rose from 2,215 to 2,291 thousand rupees.
Matrix vs data frame: which should you use?
Both look like tables, so beginners often wonder when to use which. The deciding question is whether every value has the same type.
| Matrix | Data frame | |
|---|---|---|
| Value types | One type for all cells | Each column can differ |
| Typical content | Numbers only: sales grids, distances, correlations | Real datasets with text, dates and numbers |
| Maths | Fast, includes %*% |
Column by column |
| Typical source | Built in code or from functions like cor() |
Read from CSV, Excel or SQL |
Most data you import will become a data frame, covered next in R data frames. Matrices appear when you need fast numeric work, such as a correlation table in descriptive statistics in R.
If you use Python too, NumPy's 2-D arrays are the equivalent. This runs in the browser:
import numpy as np

oct = np.array([[412, 168, 95],
                [356, 141, 88],
                [298, 102, 121],
                [264, 97, 73]])
print("Row totals:", oct.sum(axis=1))
print("Column totals:", oct.sum(axis=0))
print("Rajwada snacks:", oct[2, 2])
print(np.array([[2, 1, 0], [0, 3, 4]]) @ np.array([165, 60, 90]))
NumPy fills row by row and counts from 0, so oct[2, 2] is the third row and third column.
Common mistakes with R matrices
- Forgetting column-wise filling. Typing values row by row without
byrow = TRUEscrambles the table. - Mixing types. Adding a text column with
cbind()turns every number into text. Use a data frame instead. - Using
*for matrix multiplication.*multiplies cell by cell;%*%does matrix multiplication. - Losing the shape.
m[1, ]returns a vector. Adddrop = FALSEif later code needs a matrix. - Non-conforming dimensions.
%*%needs the left matrix's column count to equal the right side's length or row count. - Mixing up apply margins.
1is rows and2is columns. Check one result by hand the first time.
To lock in the indexing rules, solve matrix and array questions on Debugshala Test. Learners who want guided projects on grids like this can join the Indore data analytics batches run by Debugshala.
Key takeaways
- A matrix is a two-dimensional, single-type structure; an array adds more dimensions.
matrix()fills by column unlessbyrow = TRUE.- Index with
[row, column], leaving a side blank for "all", and usedrop = FALSEto keep the shape. rowSums(),colSums()andapply()summarise rows or columns quickly.*is element-wise;%*%is matrix multiplication;t()transposes.- Use a data frame instead when columns need different types.
FAQ
What is the difference between a matrix and an array in R?
A matrix has exactly two dimensions, rows and columns. An array can have any number of dimensions, so a matrix is simply a two-dimensional array. Both hold one data type only. You create arrays with array(values, dim = c(...)) and index them with one position per dimension.
How do you create a matrix by row in R?
Add byrow = TRUE to matrix(), as in matrix(1:6, nrow = 2, byrow = TRUE). R then fills the first row left to right before moving to the second. Without it, R fills the first column top to bottom first, which is the default.
How do I add row and column names to a matrix in R?
Pass dimnames = list(row_names, col_names) when calling matrix(), or set them afterwards with rownames(m) <- c(...) and colnames(m) <- c(...). Names make indexing such as m["Palasia", "Dairy"] possible and keep labels attached in printed results and summaries.
What does %*% mean in R?
%*% is R's matrix multiplication operator. It multiplies rows of the left matrix by columns of the right one and sums the products, so a quantities matrix times a price vector gives each order's bill total. The ordinary * operator multiplies matching cells instead.
Can I learn R matrices as part of a data analytics course in Indore?
Yes. Debugshala teaches R and Python for analytics at its Old Palasia campus in Indore, including matrices, data frames and summary functions. Classes are in English and Hindi, there is a free demo class, and the programme accepts fresh graduates and non-IT learners.
From the team behind this site
Go further with the Data Analytics Course at Debugshala
These tutorials are written by Debugshala, a training and placement institute at Old Palasia, Indore. The classroom course adds live mentoring, real projects and interview preparation.
- Offline classes at Old Palasia, Indore
- Free demo class before you pay
- Non-IT, fresher and year-gap friendly
- Placement assistance
700+ students placed · 200+ hiring partners · 4.9★ Google rating
