

R Data Frames: Create, Filter, Sort and Summarise Tables
Learn R data frames on a real orders table: create and inspect them, pick rows and columns, add columns, filter, sort and total sales with aggregate().
Every evening, the eight latest Malwa Mart orders land in one sheet. Each line is an order. Across the top are the headings: order number, store, product, category, quantity, price and whether it was paid online. Some columns hold text, some hold numbers, one holds yes/no ticks.
The owner wants three things from this sheet: the big orders, the orders sorted by value, and the total per store. In Excel you would filter, sort and build a pivot table. In R you write three short lines, and they work the same on 8 rows or 8 lakh rows.
In R that sheet is a data frame. Each heading is a column, each line is a row (an observation), and each column is a vector of one type. The columns are tied together like the elements of a list, with the rule that they all have the same length.
A data frame in R is a two-dimensional table made of equal-length column vectors, where each column has a single data type but different columns can hold different types.
This is the structure you will use most as an analyst. It is the last lesson in the core R data structures, after R matrices and arrays, and it targets R 4.4+.
How do you create a data frame in R?
Pass named vectors of equal length to data.frame(). Each name becomes a column heading. Here is the Malwa Mart orders table that the rest of the R series builds on.
orders <- data.frame(
  order_id    = 1001:1008,
  store       = c("Vijay Nagar", "Palasia", "Rajwada", "Vijay Nagar",
                  "Bhawarkuan", "Palasia", "Rajwada", "Vijay Nagar"),
  product     = c("Basmati Rice 5kg", "Poha 1kg", "Toor Dal 1kg", "Paneer 200g",
                  "Detergent 2kg", "Sev 500g", "Butter 500g", "Namkeen Mix 400g"),
  category    = c("Grocery", "Grocery", "Grocery", "Dairy",
                  "Household", "Snacks", "Dairy", "Snacks"),
  qty         = c(1, 3, 2, 4, 1, 2, 1, 3),
  price       = c(520, 60, 165, 90, 340, 120, 275, 110),
  paid_online = c(TRUE, FALSE, TRUE, TRUE, FALSE, TRUE, FALSE, TRUE)
)

orders order_id store product category qty price paid_online
1 1001 Vijay Nagar Basmati Rice 5kg Grocery 1 520 TRUE
2 1002 Palasia Poha 1kg Grocery 3 60 FALSE
3 1003 Rajwada Toor Dal 1kg Grocery 2 165 TRUE
4 1004 Vijay Nagar Paneer 200g Dairy 4 90 TRUE
5 1005 Bhawarkuan Detergent 2kg Household 1 340 FALSE
6 1006 Palasia Sev 500g Snacks 2 120 TRUE
7 1007 Rajwada Butter 500g Dairy 1 275 FALSE
8 1008 Vijay Nagar Namkeen Mix 400g Snacks 3 110 TRUEThe numbers on the far left are row names. R creates them automatically as 1, 2, 3 and so on. If one vector were shorter than the others, data.frame() would stop with an error instead of guessing.
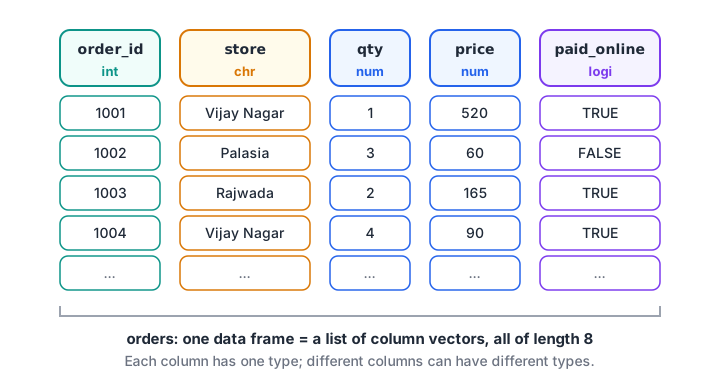
A data frame is a list of column vectors that share one length. Each column keeps its own type.
How do you inspect a data frame?
Before analysing any table, check its size, column types and value ranges. Four functions cover almost every first look.
dim(orders)
str(orders)
head(orders, 3)
summary(orders[, c("qty", "price")])[1] 8 7
'data.frame': 8 obs. of 7 variables:
$ order_id : int 1001 1002 1003 1004 1005 1006 1007 1008
$ store : chr "Vijay Nagar" "Palasia" "Rajwada" "Vijay Nagar" ...
$ product : chr "Basmati Rice 5kg" "Poha 1kg" "Toor Dal 1kg" "Paneer 200g" ...
$ category : chr "Grocery" "Grocery" "Grocery" "Dairy" ...
$ qty : num 1 3 2 4 1 2 1 3
$ price : num 520 60 165 90 340 120 275 110
$ paid_online: logi TRUE FALSE TRUE TRUE FALSE TRUE ...
order_id store product category qty price paid_online
1 1001 Vijay Nagar Basmati Rice 5kg Grocery 1 520 TRUE
2 1002 Palasia Poha 1kg Grocery 3 60 FALSE
3 1003 Rajwada Toor Dal 1kg Grocery 2 165 TRUE
qty price
Min. :1.000 Min. : 60.0
1st Qu.:1.000 1st Qu.:105.0
Median :2.000 Median :142.5
Mean :2.125 Mean :210.0
3rd Qu.:3.000 3rd Qu.:291.2
Max. :4.000 Max. :520.0 str() is the most useful: it lists every column with its type, int, chr, num or logi, and the first few values. If a price column shows chr, the file contained text such as "Rs. 520", and you need to fix it before doing maths, as explained in the R data types lesson. In RStudio, View(orders) opens a spreadsheet-style viewer.
How do you select rows and columns in a data frame?
A data frame accepts the same [row, column] indexing as a matrix, plus the $ and [[ ]] shortcuts from lists. Each part can be numbers, names or a logical condition.
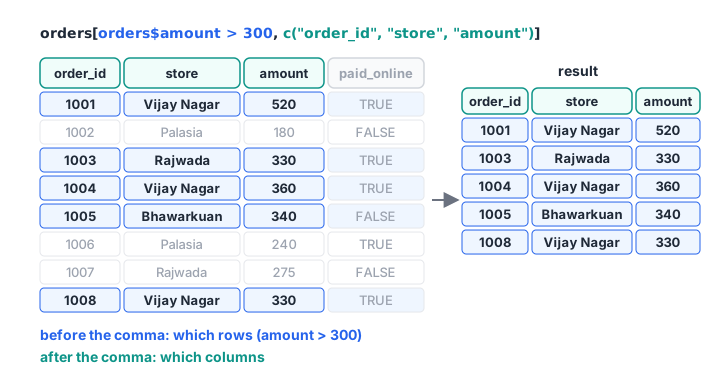
Rows go before the comma and columns after it. A condition on the left keeps matching rows; names on the right keep chosen columns.
orders$price
orders[["store"]][1:3]
orders[2, ]
orders[2, "product"]
orders[1:3, c("product", "qty")][1] 520 60 165 90 340 120 275 110
[1] "Vijay Nagar" "Palasia" "Rajwada"
order_id store product category qty price paid_online
2 1002 Palasia Poha 1kg Grocery 3 60 FALSE
[1] "Poha 1kg"
product qty
1 Basmati Rice 5kg 1
2 Poha 1kg 3
3 Toor Dal 1kg 2orders$price returns a plain vector, so every vector function works on it: mean(orders$price), max(orders$price) and so on. orders[2, ] returns a one-row data frame because the columns can have different types.
Quick check
Which line keeps only the rows of orders where amount is above 300?
Row conditions go before the comma. Leaving the part after the comma empty keeps all columns.
Quick check
What does str(orders) show?
str() prints the structure: number of rows and columns, and each column's type and sample values.
How do you add and change columns?
Assign to a new name with $ and R adds the column. Because columns are vectors, arithmetic between them is element by element, row by row.
orders$amount <- orders$qty * orders$price
orders$size   <- ifelse(orders$amount >= 300, "Large", "Small")

orders[, c("order_id", "store", "amount", "size")] order_id store amount size
1 1001 Vijay Nagar 520 Large
2 1002 Palasia 180 Small
3 1003 Rajwada 330 Large
4 1004 Vijay Nagar 360 Large
5 1005 Bhawarkuan 340 Large
6 1006 Palasia 240 Small
7 1007 Rajwada 275 Small
8 1008 Vijay Nagar 330 Largeifelse() checks a condition for every row and picks one of two values. To remove a column, assign NULL, as in orders$size <- NULL. To rename one, change its entry in names(orders).
How do you filter a data frame in R?
Put a condition before the comma. The condition is a logical vector with one TRUE or FALSE per row, and only the TRUE rows are kept. Join conditions with & (and) and | (or).
orders[orders$amount > 300, c("order_id", "store", "amount")]

orders[orders$store == "Palasia" & orders$paid_online, c("order_id", "product")]

subset(orders, category == "Snacks", select = c(product, amount)) order_id store amount
1 1001 Vijay Nagar 520
3 1003 Rajwada 330
4 1004 Vijay Nagar 360
5 1005 Bhawarkuan 340
8 1008 Vijay Nagar 330
order_id product
6 1006 Sev 500g
product amount
6 Sev 500g 240
8 Namkeen Mix 400g 330subset() saves typing because it lets you write column names without orders$. It is convenient at the console. Inside scripts and functions, the bracket form or dplyr's filter() is safer and clearer.
How do you sort a data frame?
order() returns the row positions that would sort a column. Put it before the comma to rearrange the rows. A minus sign sorts numbers in descending order, and extra arguments break ties.
by_value <- orders[order(-orders$amount), c("order_id", "store", "amount")]
head(by_value, 3)

orders[order(orders$store, -orders$amount), c("store", "product", "amount")] order_id store amount
1 1001 Vijay Nagar 520
4 1004 Vijay Nagar 360
5 1005 Bhawarkuan 340
store product amount
5 Bhawarkuan Detergent 2kg 340
6 Palasia Sev 500g 240
2 Palasia Poha 1kg 180
3 Rajwada Toor Dal 1kg 330
7 Rajwada Butter 500g 275
1 Vijay Nagar Basmati Rice 5kg 520
4 Vijay Nagar Paneer 200g 360
8 Vijay Nagar Namkeen Mix 400g 330The second line sorts by store name alphabetically, then by amount from highest to lowest within each store. That is the R version of SQL's ORDER BY store, amount DESC.
How do you summarise a data frame by group?
Summaries turn rows into answers. aggregate() groups rows and applies a function to each group, much like a pivot table. table() counts how often each value appears.
aggregate(amount ~ store, data = orders, FUN = sum)
table(orders$category)
mean(orders$paid_online)
tapply(orders$amount, orders$paid_online, mean) store amount
1 Bhawarkuan 340
2 Palasia 420
3 Rajwada 605
4 Vijay Nagar 1210
Dairy Grocery Household Snacks
2 3 1 2
[1] 0.625
FALSE TRUE
265 356 Vijay Nagar brings in the most revenue, 1,210 rupees across three orders. Five of eight orders, 62.5 percent, were paid online, and online orders average 356 rupees against 265 for cash. That is a first real insight from the dataset.
For bigger summaries with several measures at once, analysts switch to dplyr, whose group_by() and summarise() read almost like plain English.
Adding rows and reading CSV text
rbind() appends rows that have the same columns. In real work, data comes from files with read.csv(); here the CSV is supplied as text so you can try it without a file.
new_order <- data.frame(order_id = 1009L, store = "Bhawarkuan", product = "Poha 1kg",
                        category = "Grocery", qty = 5, price = 60, paid_online = TRUE,
                        amount = 300, size = "Large")
orders <- rbind(orders, new_order)
nrow(orders)

stock <- read.csv(text = "product,units
Poha 1kg,40
Sev 500g,25")
stock
str(stock)[1] 9
product units
1 Poha 1kg 40
2 Sev 500g 25
'data.frame': 2 obs. of 2 variables:
$ product: chr "Poha 1kg" "Sev 500g"
$ units : int 40 25Since R 4.0, read.csv() keeps text as character columns by default (stringsAsFactors = FALSE). Older tutorials that add this argument by hand are not wrong, just from before 4.0. Reading real CSV and Excel files is covered in reading data in R.
Data frames in pandas
A pandas DataFrame is the Python twin of an R data frame. This runs in the browser and gives the same store totals:
import pandas as pd

orders = pd.DataFrame({
    "store": ["Vijay Nagar", "Palasia", "Rajwada", "Vijay Nagar",
              "Bhawarkuan", "Palasia", "Rajwada", "Vijay Nagar"],
    "qty": [1, 3, 2, 4, 1, 2, 1, 3],
    "price": [520, 60, 165, 90, 340, 120, 275, 110],
})
orders["amount"] = orders["qty"] * orders["price"]
print(orders[orders["amount"] > 300])
print(orders.groupby("store")["amount"].sum())
Pandas counts rows from 0 and uses groupby() where base R uses aggregate(). The pandas DataFrame tutorial covers it in depth.
Common mistakes with R data frames
- Forgetting the comma.
orders[orders$amount > 300](no comma) is treated as column selection. It either stops with "undefined columns selected" or, worse, quietly returns the wrong columns. Writeorders[orders$amount > 300, ]. - Leaving out
orders$in a condition.orders[amount > 300, ]looks for a standaloneamountvariable. - Using
=instead of==. Comparisons need==. - Filtering on a column with
NA. Rows where the condition isNAcome back as rows full ofNA. Usewhich()orsubset(), which drop them. - Sorting text numbers. If
amountis character,"1210"sorts before"300". Convert withas.numeric()first. - Growing a data frame row by row in a loop. It is slow. Build the vectors first, then call
data.frame()once.
Try a few practice rounds to make these habits automatic: take the data handling quizzes on Debugshala Test. For projects that take a data frame all the way to a dashboard, look at Debugshala's placement-focused analytics course in Indore.
Key takeaways
- A data frame is a table of equal-length column vectors, each with its own type.
- Check every new table with
dim(),str(),head()andsummary(). - Index with
df[rows, columns], or take one column withdf$col. - Add columns by assignment, filter with a condition before the comma, and sort with
order(). aggregate(),table()andtapply()produce group totals and counts.- Next, learn how R stores categories such as store names in R factors.
FAQ
What is a data frame in R?
A data frame is R's standard structure for tabular data. It stores columns as vectors of equal length, so each column has one type, while different columns can be numbers, text, dates or logical values. Data read from CSV, Excel or a database usually arrives in R as a data frame.
What is the difference between a data frame and a matrix in R?
A matrix holds one data type in every cell, so it suits numeric grids. A data frame lets each column have its own type, so it suits real datasets with text, numbers and dates together. Data frames also have column names built in and work directly with dplyr and ggplot2.
How do I filter rows in an R data frame?
Put a logical condition before the comma inside the brackets, as in df[df$amount > 300, ]. Combine conditions with & for "and" and | for "or". The subset() function and dplyr's filter() do the same job with less typing, and both drop rows where the condition is NA.
What is the difference between a data frame and a tibble?
A tibble is a modern data frame from the tibble package, used throughout the tidyverse. It prints more neatly, showing only the first rows and each column's type, and it never changes column types silently. Any function that accepts a data frame also accepts a tibble.
Where can I learn R data frames for a data analyst job in Indore?
Debugshala's data analytics programme at Old Palasia, Indore, teaches data frames in R and pandas with projects on business data. Classes are in English and Hindi, a free demo class is available, and fresh graduates and non-IT learners can join, with placement assistance offered.
From the team behind this site
Go further with the Data Analytics Course at Debugshala
These tutorials are written by Debugshala, a training and placement institute at Old Palasia, Indore. The classroom course adds live mentoring, real projects and interview preparation.
- Offline classes at Old Palasia, Indore
- Free demo class before you pay
- Non-IT, fresher and year-gap friendly
- Placement assistance
700+ students placed · 200+ hiring partners · 4.9★ Google rating
